Dashboards with Shiny for R
Introduction
The Shiny package provides an easy way to build web applications with R. Quarto dashboards can include embedded Shiny components (e.g. a plot with sliders that control its inputs).
This section covers integrating Shiny with Quarto and assumes that you already have basic familiarity with Shiny. To learn more about Shiny please visit https://shiny.posit.co/r/getstarted/shiny-basics/lesson1/index.html. If you are using Python rather than R, see the documentation on using Shiny for Python.
Walkthrough
Here we’ll explore an in-depth example that covers many of the techniques you’ll use when creating dashboards with Shiny, including factoring out setup code, reactive calculations, and more advanced layout constructs like sidebars and tabsets. Here is the interactive document we’ll be building:
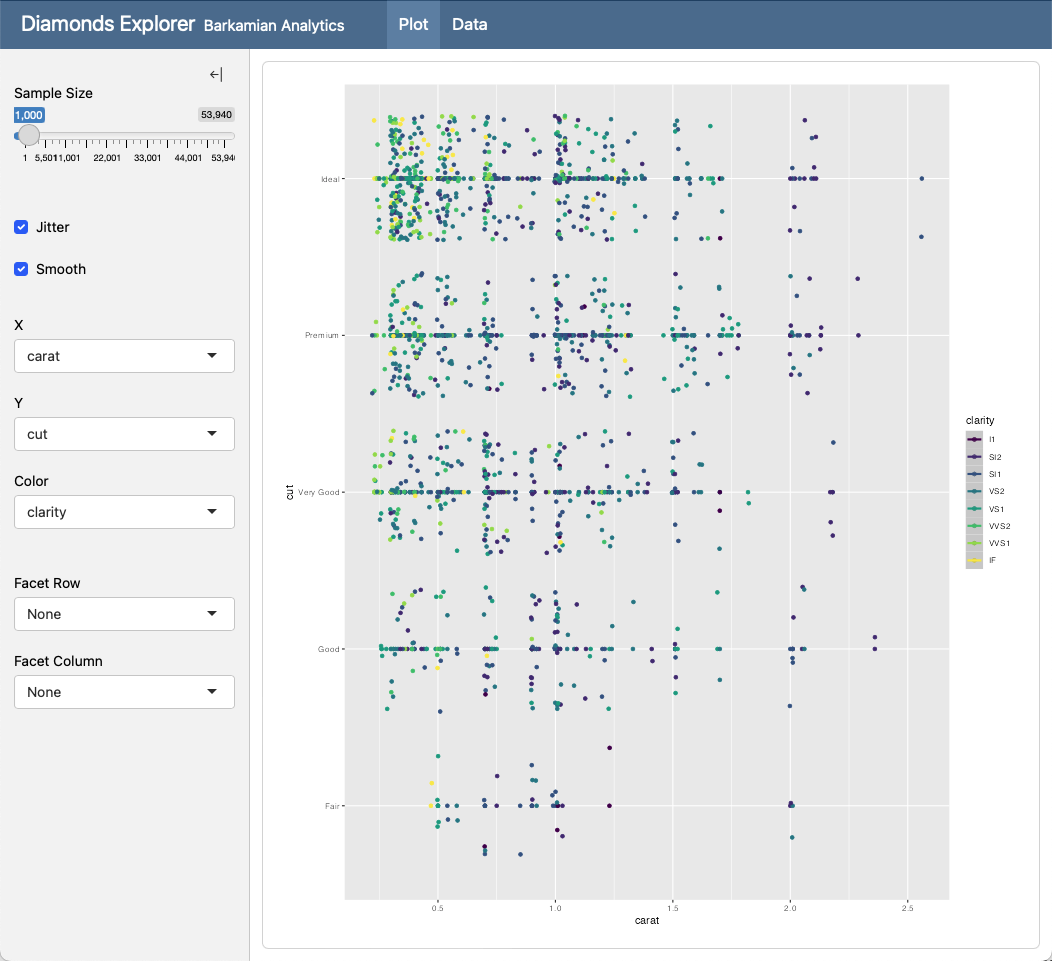
Here is the source code for this dashboard (click on the numbers on the far right for additional explanation of syntax and mechanics):
---
title: "Diamonds Explorer"
author: "Barkamian Analytics"
format: dashboard
server: shiny
---
```{r}
#| context: setup
library(ggplot2)
dataset <- diamonds
```
# {.sidebar}
```{r}
sliderInput('sampleSize', 'Sample Size',
min=1, max=nrow(dataset),
value=min(1000, nrow(dataset)),
step=500, round=0)
br()
checkboxInput('jitter', 'Jitter')
checkboxInput('smooth', 'Smooth')
```
```{r}
selectInput('x', 'X', names(dataset))
selectInput('y', 'Y', names(dataset), names(dataset)[[2]])
selectInput('color', 'Color', c('None', names(dataset)))
```
```{r}
selectInput('facet_row', 'Facet Row',
c(None='.', names(diamonds[sapply(diamonds, is.factor)])))
selectInput('facet_col', 'Facet Column',
c(None='.', names(diamonds[sapply(diamonds, is.factor)])))
```
# Plot
```{r}
plotOutput('plot')
```
# Data
```{r}
tableOutput('data')
```
```{r}
#| context: server
dataset <- reactive({
diamonds[sample(nrow(diamonds), input$sampleSize),]
})
output$plot <- renderPlot({
p <- ggplot(
dataset(),
aes_string(x=input$x, y=input$y)) + geom_point()
if (input$color != 'None')
p <- p + aes_string(color=input$color)
facets <- paste(input$facet_row, '~', input$facet_col)
if (facets != '. ~ .')
p <- p + facet_grid(facets)
if (input$jitter)
p <- p + geom_jitter()
if (input$smooth)
p <- p + geom_smooth()
p
})
output$data <- renderTable({
dataset()
})
```- 1
-
The
server: shinyoption instructs Quarto to run a Shiny Server behind the document. - 2
-
The
context: setupcell option indicates that this code cell should run when the application starts (as opposed to when each new client session starts). Expensive initialization code (e.g. loading data) should be placed incontext: setup. - 3
-
Create global sidebars by adding the
.sidebarclass to level 1 headings. Sidebars can include code cells as well as images, narrative, and links. - 4
- These select inputs have their contents dynamically driven from the available columns in the dataset.
- 5
-
Level 1 headings (here
# Plotsand# Data) create pages within the dashboard. - 6
-
Include server code (reactives that compute values or render output) in a cell with
context: server. - 7
-
The
dataset()reactive will be called to re-sample the dataset every time the sample size changes. - 8
-
The
renderPlot()function regenerates the plot whenever thedataset()reactive or another input option changes. - 9
-
The
renderTable()function regenerates the table whenever thedataset()reactive changes.
Learning More
To learn more about Shiny for R interactive documents see the following articles:
Input Layout describes various ways to layout Shiny inputs (sidebars, input panels, attaching inputs directly to cards, etc.)
Running Documents covers how to run interactive documents both within RStudio and at the command line, as well as how to deploy them to end users.
Execution Contexts goes in depth on when different code blocks (e.g. rendering vs. serving) run as well as how to cache expensive computations for more responsive documents.
External Resources describes how to make sure that Shiny can locate resources (e.g. CSS, JS, images, etc.) that you include in your document.