Figures
Quarto includes a number of features aimed at making it easier to work with figures and subfigures, as well as for laying out panels that contain multiple figures, tables, or other content.
Figure Basics
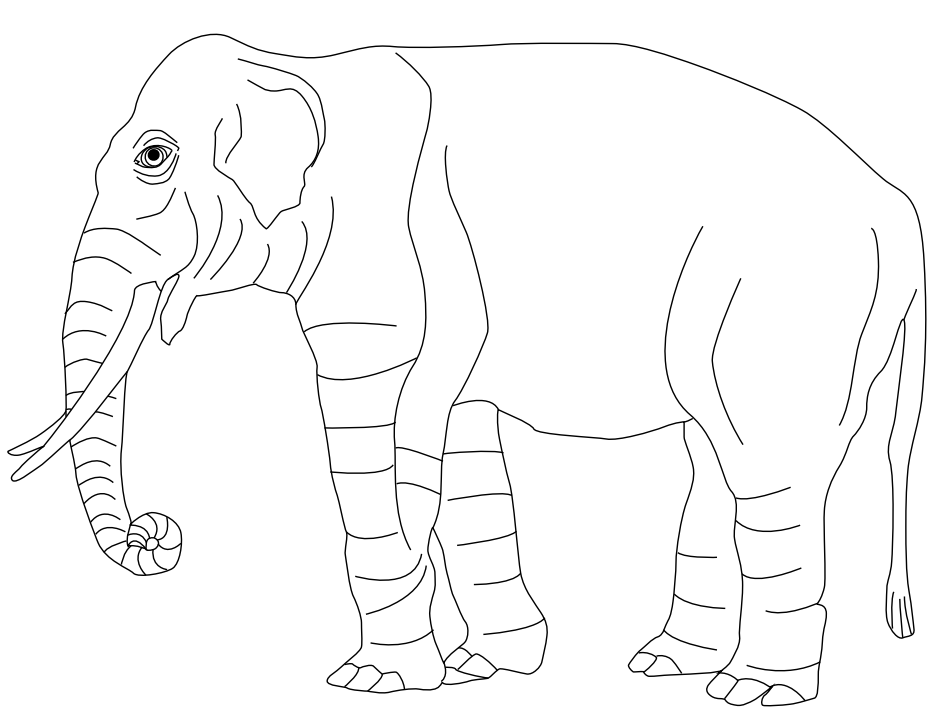
In Pandoc markdown, a figure is created whenever a captioned image appears by-itself in a paragraph. For example:
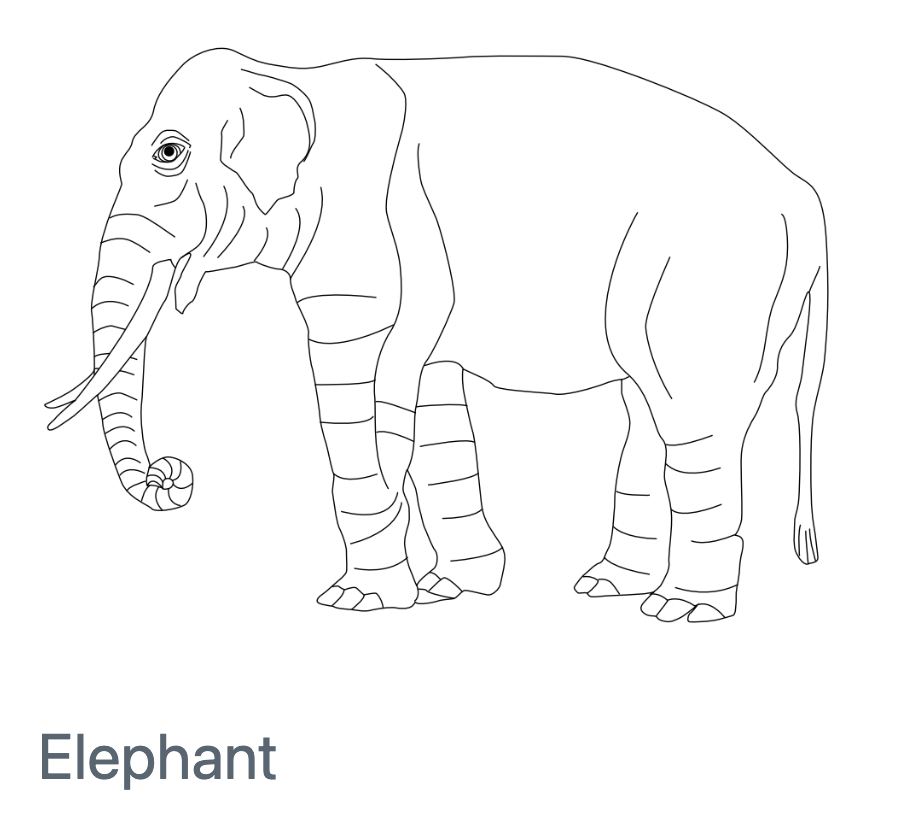
This results in the following treatment for various output types:
| HTML | Word | |
|---|---|---|
 |
 |
 |
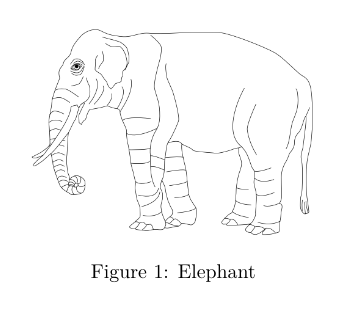
Note that for LaTeX / PDF output figures are automatically numbered (you can arrange for figures to be numbered in other formats using Cross References).
Figure Sizing
By default figures are displayed using their actual size (subject to the width constraints imposed by the page they are rendered within). You can change the display size by adding the width and height attributes to the figure. For example:
{width=300}Note that if only width is specified then height is calculated automatically. If you need to modify the default behaviour just add an explicit height attribute.
The default units for width and height are pixels. You can also specify sizes using a percentage or a conventional measurement like inches or millimetres. For example:
{width=80%}
{width=4in}Linked Figures
When rendering with Quarto, you can enclose a figure within a link and it will still be treated within output as a captioned figure. For example:
[](https://en.wikipedia.org/wiki/Elephant)Figure Alignment
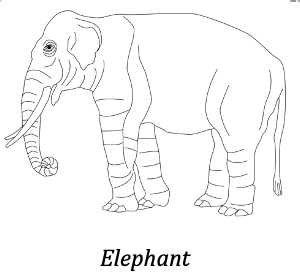
Figures are center aligned by default. Add the fig-align attribute to the image to use a different alignment. For example:
{fig-align="left"}Note that figure captions are left aligned to accommodate longer caption text (which looks odd when center aligned).
Alt Text
You can add alternative text to a figure by adding the fig-alt attribute to the image. For example, the following Markdown…
{fig-alt="A drawing of an elephant."}… will create the following HTML with the corresponding alt tag:
<img src="elephant.png" alt="A drawing of an elephant.">Note that the figure caption, title, and alt text can all be different. For example, the following code…
{fig-alt="A drawing of an elephant."}…produces this HTML:
<img src="elephant.png" title="Title: An elephant" alt="A drawing of an elephant.">To render the caption instead as alt text you can append a backslash to the line as detailed in the Pandoc documentation:
\Multiformat Figures
You can write markdown that provides a distinct image file format depending on the target output format. To do this simply leave off the extension, for example:
Quarto will look for a file matching the extension associated with the target output format. The default extension per format is:
| Format | Default extension |
|---|---|
html, epub, docx, pptx, and most others |
.png |
pdf (via LaTeX / Beamer) |
.pdf |
typst |
.svg |
So for :
- Rendering to
htmllooks forelephant.png - Rendering to
pdf(LaTeX) looks forelephant.pdf - Rendering to
typstlooks forelephant.svg
You can override the default per format using the default-image-extension option:
format:
  html:
    default-image-extension: svg
  pdf:
    default-image-extension: tex
  typst:
    default-image-extension: png
If you have images with no extension at all (e.g. remote URLs like badge URLs), set default-image-extension to an empty string to prevent Quarto from appending one:
format:
  html:
    default-image-extension: ""
Lightbox Figures
In HTML output formats you can add lightbox styling and behavior to images to allow a reader to click to see a larger version of the image. For example, the following image has lightbox treatment (click on the image to see lightbox in action):

Lightbox treatment can be added by adding the class .lightbox to an image:
{.lightbox}For further details and other ways to enable and disable lightbox treatment see Lightbox Figures.
Applying Multiple Parameters
To combine the above methods, separate arguments by a space, for example:
{fig-alt="A drawing of an elephant." fig-align="left" width=20%}Cross References
You can cross-reference figures by adding an ID with the fig- prefix to them, and then referencing the figure using the @ prefix. For example:
{#fig-elephant}
This is illustrated well by @fig-elephant.For figures produced by executable code cells, include a label with a fig- prefix to make them cross-referenceable. For example:
For a demonstration of a line plot, see @fig-line-plot.

```{python}
#| label: fig-line-plot
#| fig-cap: "A line plot "

import matplotlib.pyplot as plt
plt.plot([1,23,2,4])
plt.show()
```In order for a figure to be cross-referenceable, its label must start with the fig- prefix.
See the article on Cross References for additional details.
Subfigures
If you have several figures that appear as a group, you can create a figure div to enclose them. For example:
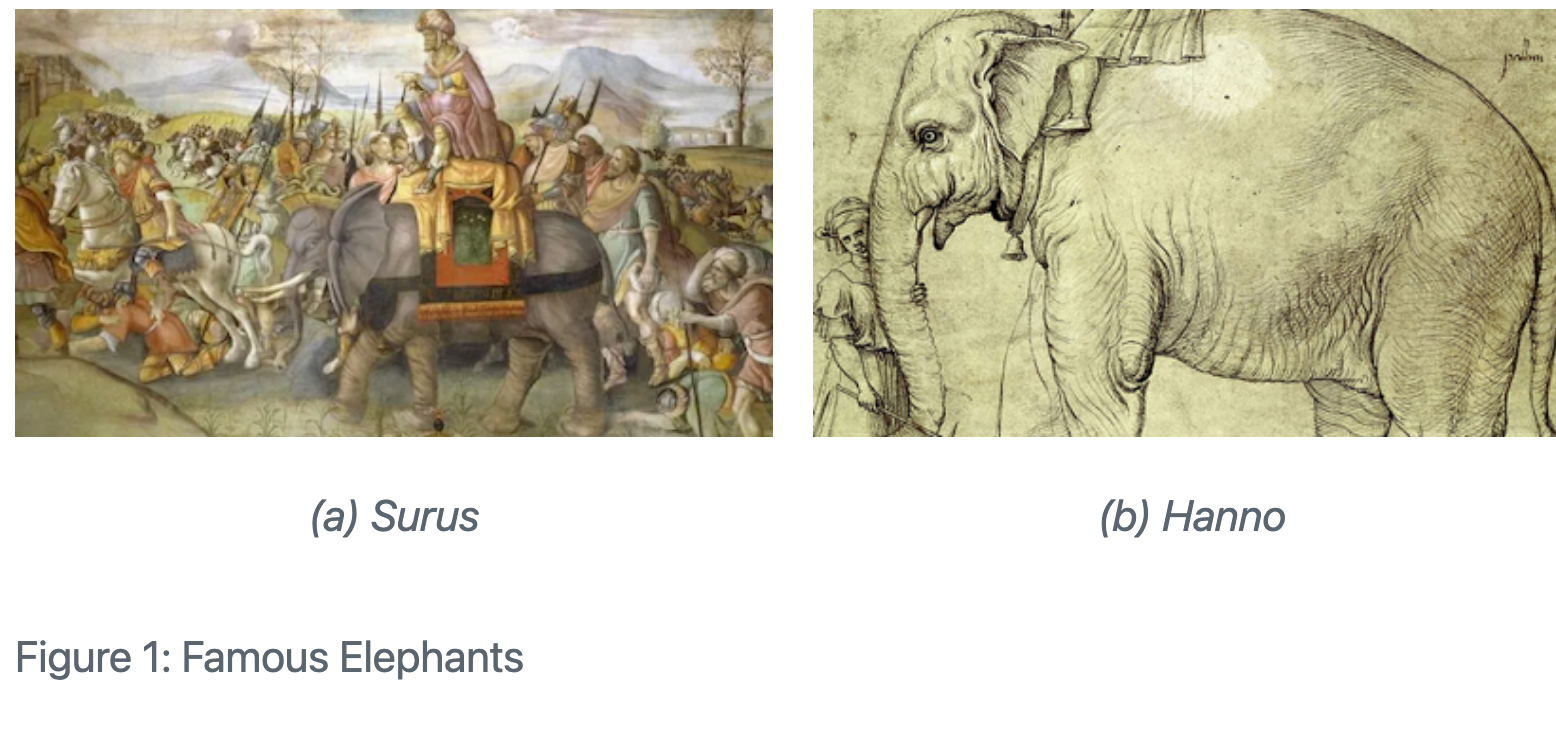
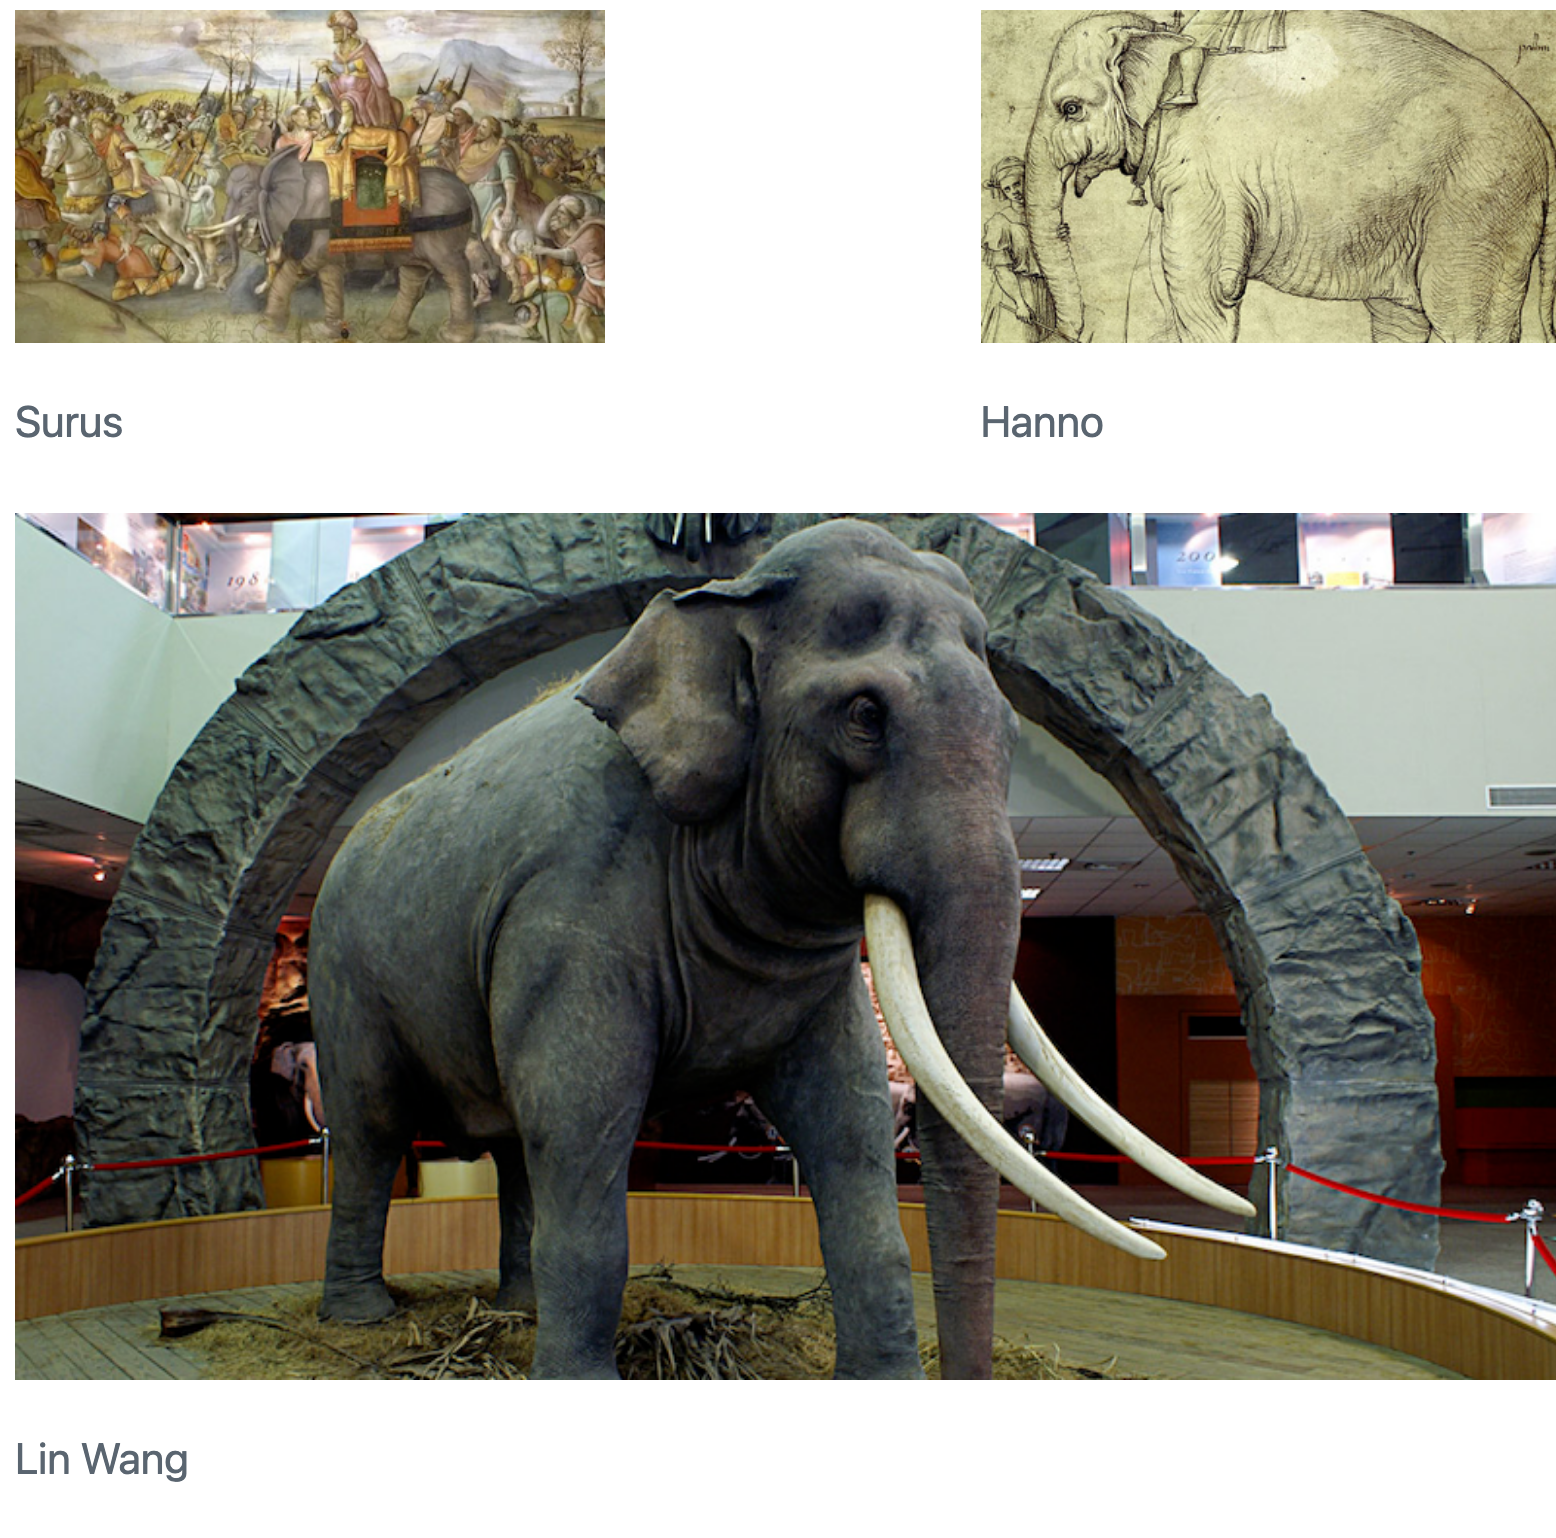
::: {#fig-elephants layout-ncol=2}
{#fig-surus}
{#fig-hanno}
Famous Elephants
:::Again, the last paragraph provides the main caption, and the individual figures carry the sub-captions. Here is what this looks like when rendered as HTML:
Note that the empty lines between the figures (and between the last figure and the caption) are required (it’s what indicates that these images belong to their own paragraphs rather than being multiple images within the same paragraph).
Note also that we also used a layout-ncol attribute to specify a two-column layout. The next section delves more into customizing figure layouts.
Figure Panels
Above we demonstrate laying out two side-by-side figures with subcaptions and a main caption. You may or may not want the caption / sub-caption treatment, and you might also want to use multiple rows of figures. All of these variations are possible.
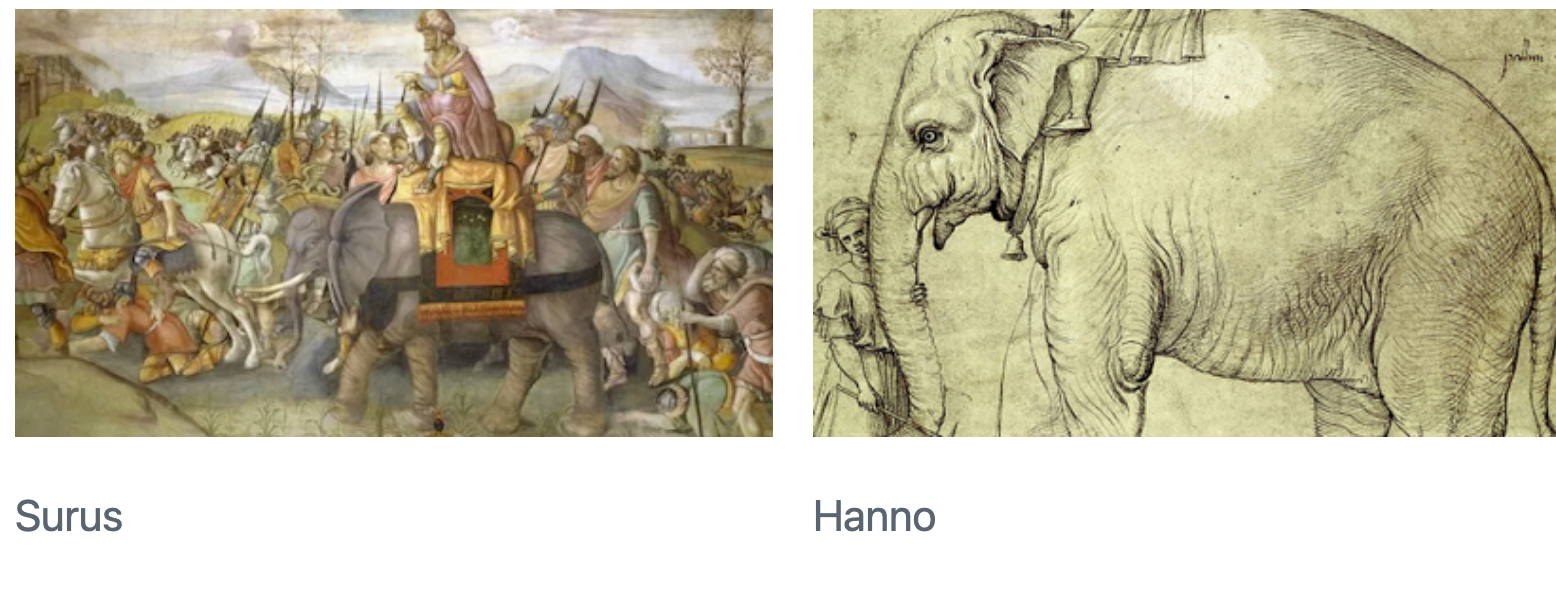
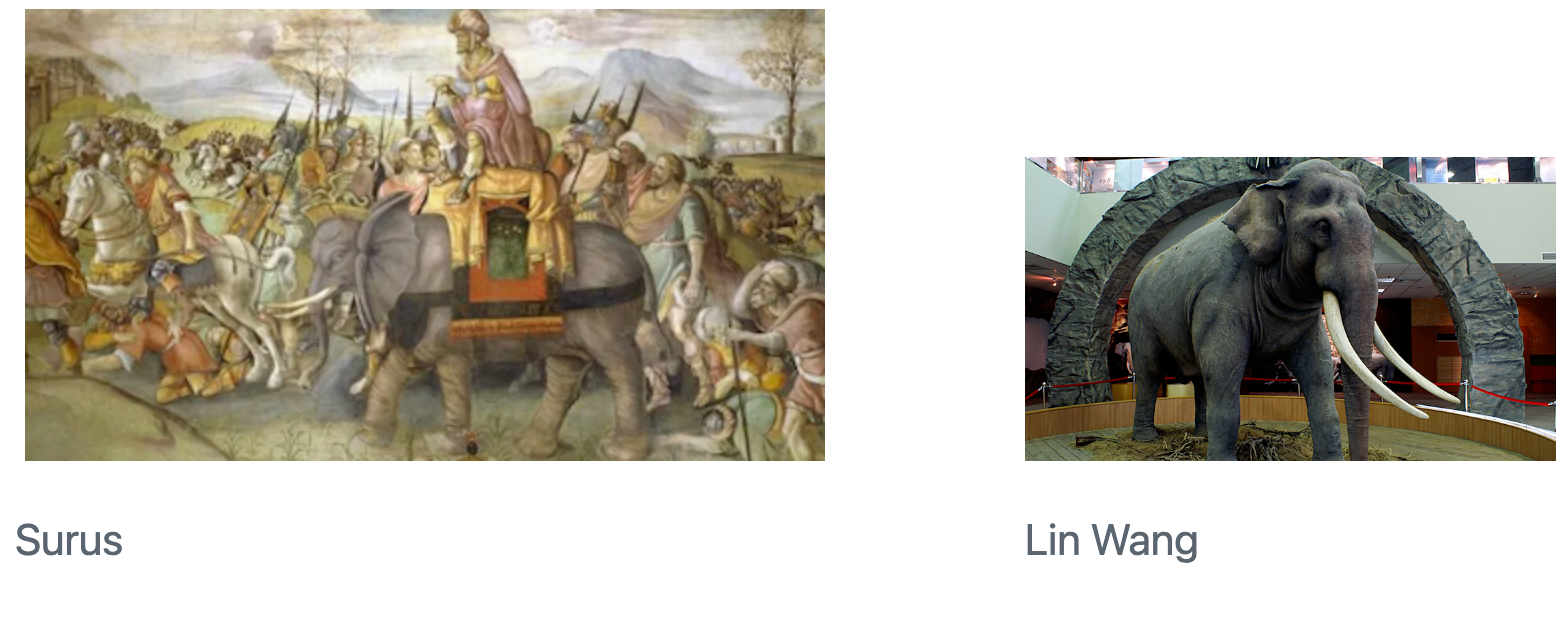
To layout two figures with their own standalone captions (and no main caption), just eliminate the #fig identifiers and main caption at the bottom:
::: {layout-ncol=2}


:::
You can also eliminate the captions entirely:
::: {layout-ncol=2}


:::Multiple Rows
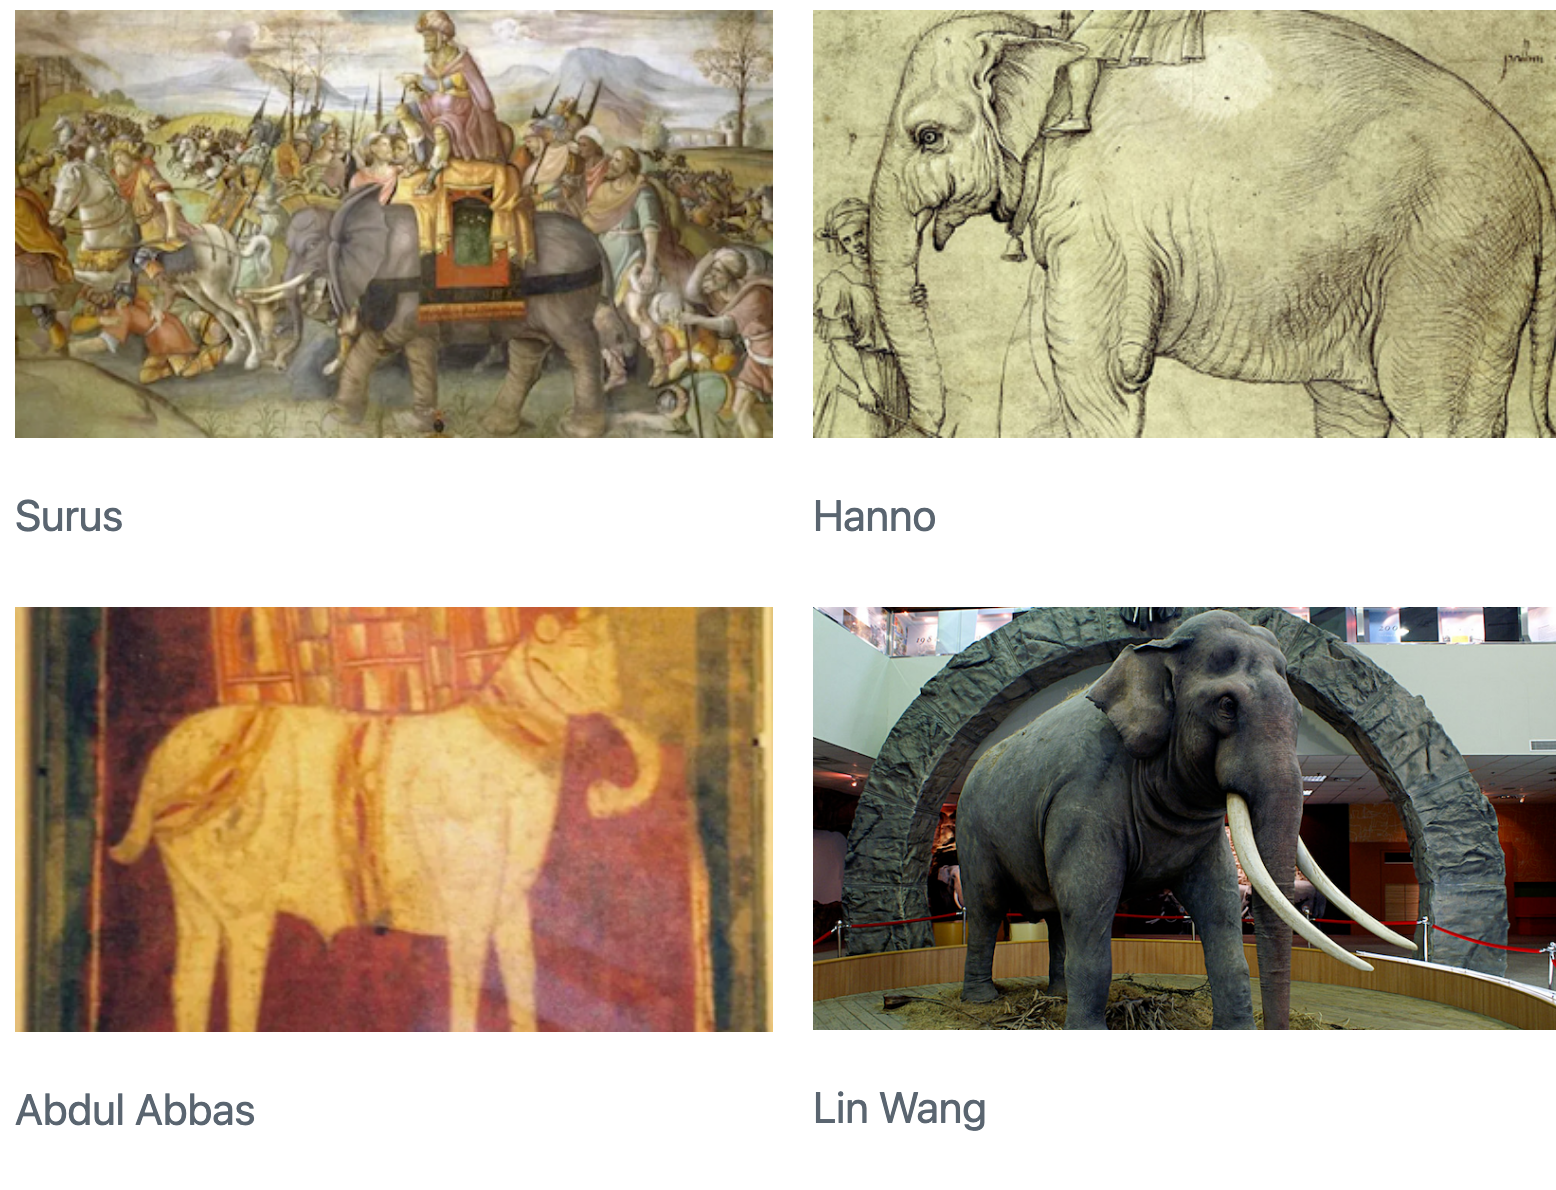
If you have more than 2 images, you might want to lay them out across multiple rows. You can do this using the layout-nrow attribute. For example:
::: {layout-nrow=2}


:::
More complex figure arrangements (e.g. rows with varying column layouts) are possible. See the Custom Layouts section below for more details.
Figure Divs
You can treat any markdown content you want as a figure by enclosing it in Pandoc div block with an identifier prefaced with #fig-. For example, here we create a figure that includes an embedded iframe:
::: {#fig-elephant}

<iframe width="560" height="315" src="https://www.youtube.com/embed/SNggmeilXDQ"></iframe>

Elephant
:::
Note that the last paragraph in the div block is used as the figure caption.
LaTeX Figures
This section describes some figure handling options that are specific to LaTeX output.
One very important thing to note is that using the fig-env and fig-pos options described below will trigger the creation of a LaTeX floating environment (most often \begin{figure}). Depending upon where this LaTeX is generated (e.g., within another \begin{figure}), this could produce invalid LaTeX. To be on the safe side, these attributes should typically only be used for images at the very top level of your document.
Environments
There are a number of LaTeX packages that provide custom figure environments. For example, in two-column formats, the figure* environment spans both columns of the document. You can explicitly pass the figure environment to use as the fig-env attribute of the image or the fenced div:
{#fig-elephant fig-env="figure*"}
::: {#fig-elephant-2 fig-env="figure*"}

Another elephant.
:::Figure Position
The default LaTeX figure is a floating environment, so the specific location it appears in your document will depend on its size and the nature of the other content around it. You can exercise some control over this behavior using the fig-pos option. The fig-pos option provides a placement specifier for the figure environment. For example, the ht in this LaTeX snippet is the fig-pos:
\begin{figure}[ht]

\end{figure}
You can specify fig-pos either at the document level, as an executable code block option, or within markdown. Here we do all three:
---
title: "My Document"
format:
pdf:
fig-pos: 'h'
---
```{python}
#| fig-pos: 't'
```
{fig-pos='b'}See this article for additional details on LaTeX figure positioning.
If your figure was generated by an executable code block and the code was included in the output (echo: true), then fig-pos will be set to H by default (to try to keep it alongside the code that generated it). In all other cases, default LaTeX handing of figure position is used unless you specify an explicit fig-pos.
Short Captions
You can provide a short caption that is used in the “List of Figures” using the fig-scap option. You can specify fig-scap as an executable code block option or as an attribute on an image:
```{python}
#| fig-cap: "Long caption"
#| fig-scap: "Short caption"
```
{fig-scap='Short caption'}PGF/TikZ Graphics
If you are creating LaTeX output, Quarto will automatically emit the correct LaTeX for markdown images that reference .tex files containg PGF/TikZ vector graphics. For example, the following markdown images:

{width=80%}Will be written to LaTeX as:
\input{image1.tex}

\resizebox{0.8\linewidth}{!}{\input{image2.tex}}
As shown above, width and height percentages are automatically converted to \linewidth scaled. Alternatively you can specify custom LaTeX for the width and height arguments of \resizebox.
Caption Locations
By default, figure captions are positioned below figures. In HTML and PDF formats, you can modify this behavior using the fig-cap-location option. For example:
---
fig-cap-location: top
---
Note that this option is specified at the top level so that it can be shared by both PDF and HTML formats. If you are only targeting a single format you can place it alongside other format specific options.
Valid values for the caption location include:
| Value | Description |
|---|---|
top |
Position the caption above the figure. |
bottom |
Position the caption below the figure. |
margin |
Position the caption in the margin. |
See the article on Article Layout for additional details on placing captions in the margin.
Custom Layouts
The examples above used the layout-ncol or layout-nrow attributes to create straightforward layouts where all columns are of equal sizes. The layout attribute enables the creation of much more complex layouts.
For example, this defines a layout with two equally sized figures in the first row, then another image that spans the entire second row:
::: {layout="[[1,1], [1]]"}


:::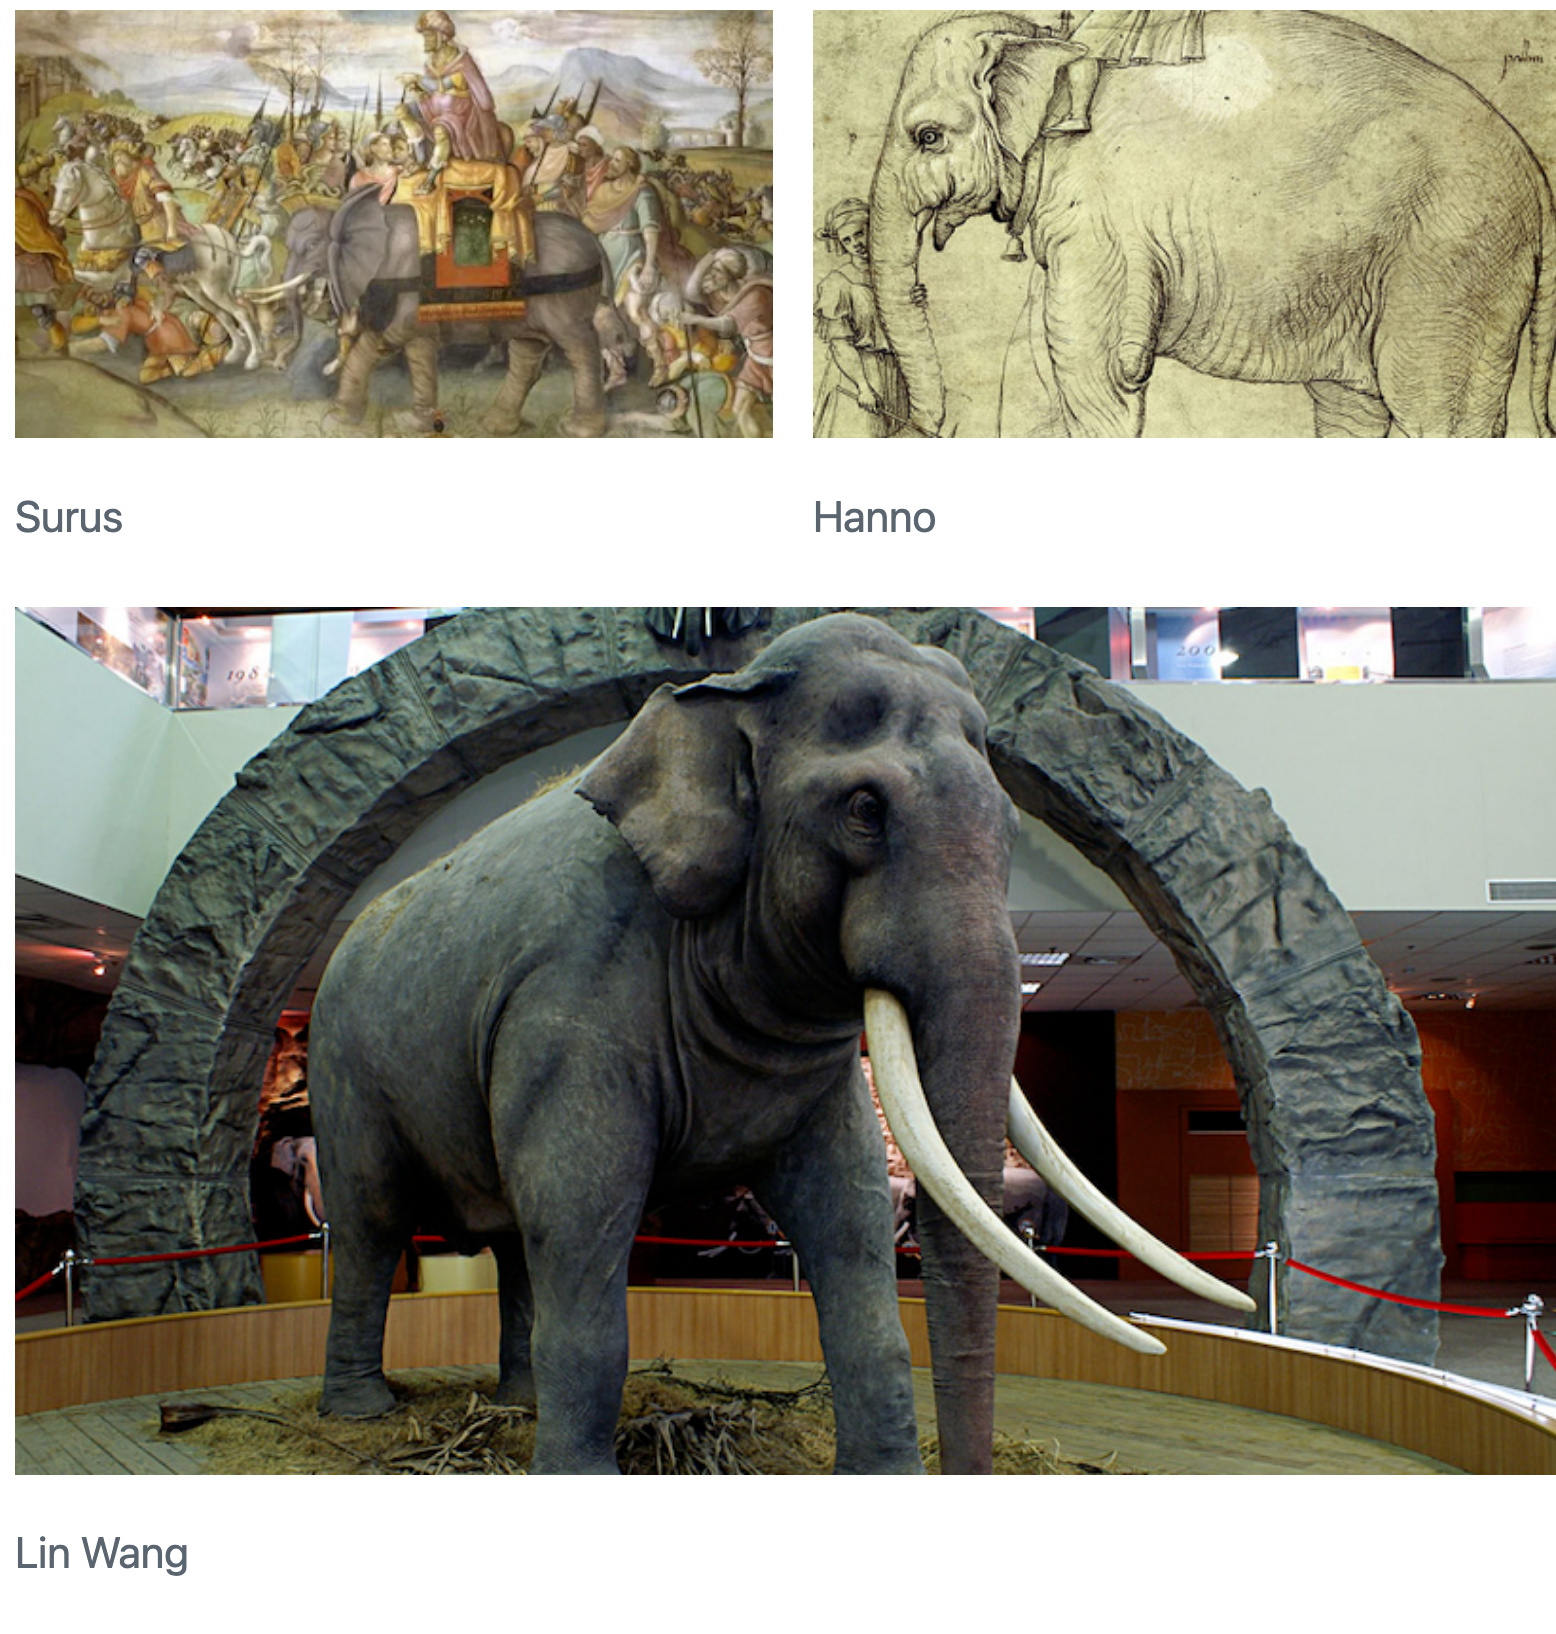
The layout attribute is a 2-dimensional array where the first dimension defines rows and the second columns. In this case "layout="[[1,1], [1]]" translates to: create two rows, the first of which has two columns of equal size and the second of which has a single column.
Note that the numbers in a row are arbitrary and don’t need to add up to a particular total. You can therefore use whatever scheme is most natural. For example, here we define columns that occupy varying percentage widths of the row:
::: {layout="[[70,30], [100]]"}


:::You can also use negative values to create space between elements. For example:
::: {layout="[[40,-20,40], [100]]"}


:::
Vertical Alignment
If you have a layout with a row of images of differing heights, you can control their vertical alignment using the layout-valign attribute. A simple example:
::: {layout="[15,-2,10]" layout-valign="bottom"}


:::
Note that vertical alignment isn’t limited to images, you can also vertically align any other elements that are included in a panel.
Computations
Figures produced by executable code blocks are automatically included in your document. To set the ID, caption and link, use the chunk options label, fig-cap and fig-link respectively. Other attributes, e.g. fig-align and fig-alt, can be set using the chunk option of the same name.
You can control the default size for computational figures using the fig-width and fig-height options in the document header.
Read more about these options in Execution Options: Figure Options.
Layout
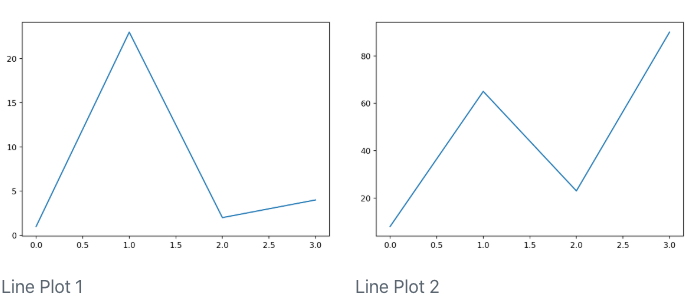
Note that figure layout attributes also work for figures produced by executable code blocks. Here are examples for both Jupyter and Knitr:
```{python}
#| layout-ncol: 2
#| fig-cap:
#|   - "Line Plot 1"
#|   - "Line Plot 2"

import matplotlib.pyplot as plt
plt.plot([1,23,2,4])
plt.show()

plt.plot([8,65,23,90])
plt.show()
```
```{r}
#| layout-ncol: 2
#| fig-cap:
#|   - "Speed and Stopping Distances of Cars"
#|   - "Vapor Pressure of Mercury as a Function of Temperature"

plot(cars)
plot(pressure)
```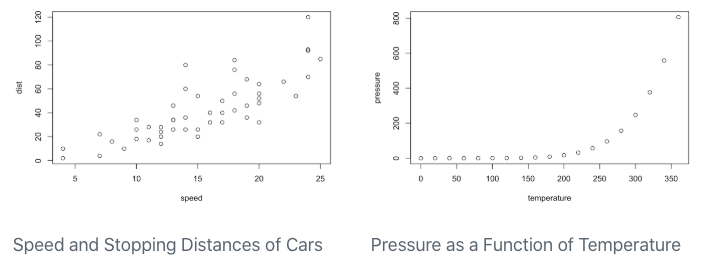
Note that in these examples we also use the fig-cap option to apply a caption to each of the generated figures.
Subcaptions
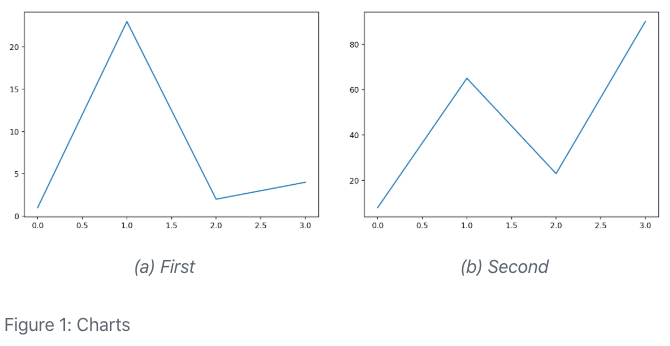
You can create subcaptions for computational output by combining the fig-cap and fig-subcap options. When applying captions to computational output you can optionally include a label with a fig- prefix—if you do this then the figure will be numbered and cross-referenceable.
```{python}
#| label: fig-charts
#| fig-cap: "Charts"
#| fig-subcap:
#|   - "First"
#|   - "Second"
#| layout-ncol: 2

import matplotlib.pyplot as plt
plt.plot([1,23,2,4])
plt.show()

plt.plot([8,65,23,90])
plt.show()
```
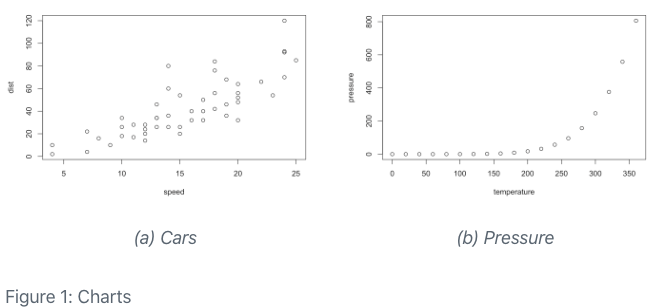
```{r}
#| label: fig-charts
#| fig-cap: "Charts"
#| fig-subcap:
#|   - "Cars"
#|   - "Pressure"
#| layout-ncol: 2

plot(cars)
plot(pressure)
```
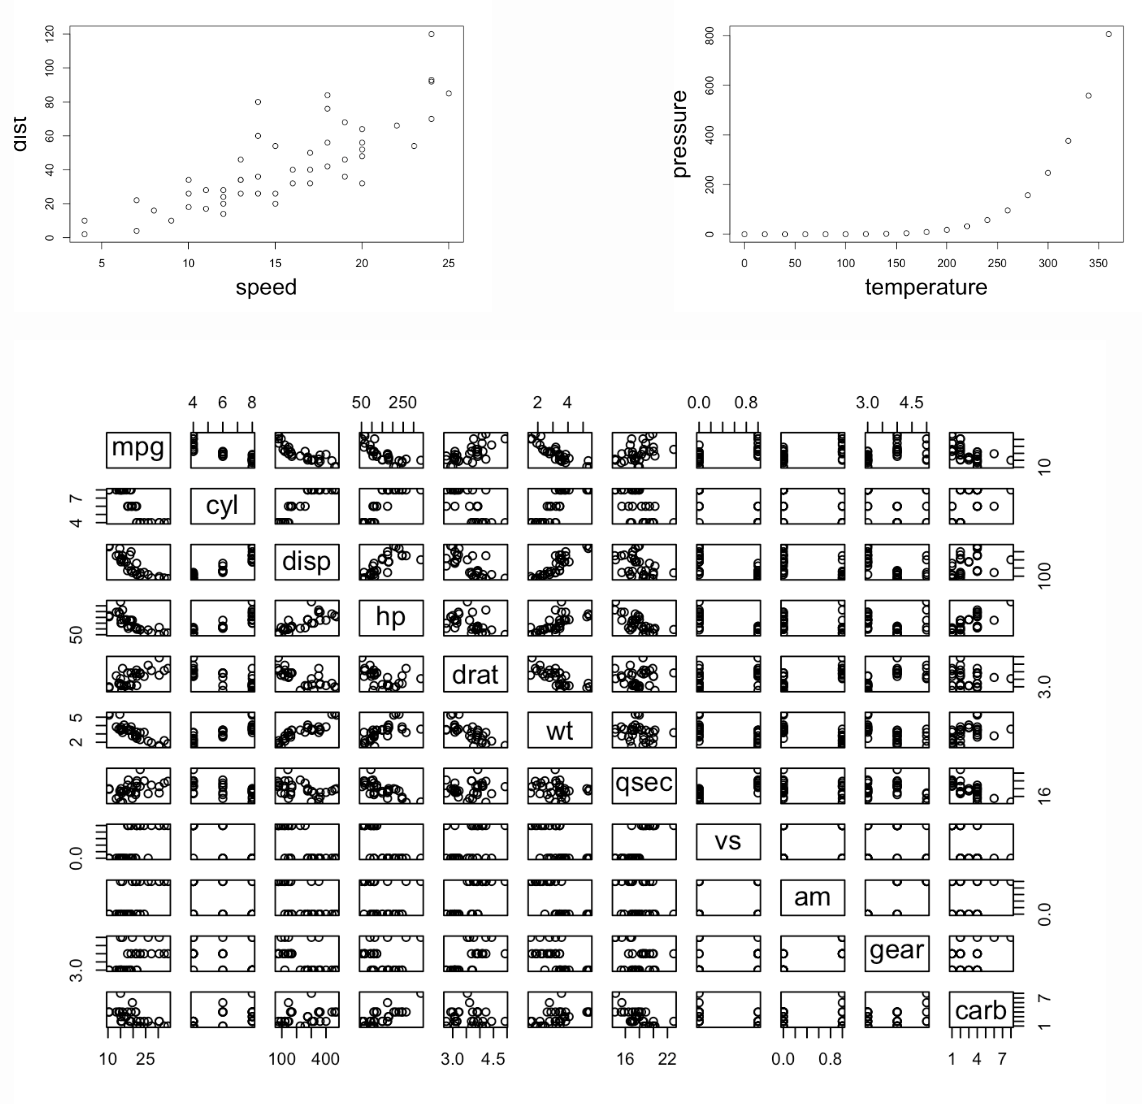
Custom Layout
The layout works the same way for figures produced by Knitr or Jupyter. For example, here’s an Rmd code chunk that produces 3 plots and defines a custom layout for them:
```{r}
#| layout: [[45,-10, 45], [100]]

plot(cars)
plot(pressure)
plot(mtcars)
```
Block Layout
While the examples above illustrate laying out figures, it’s important to note that layout attributes can be used to layout any sort of block content. For example, here we layout 2 lists side-by-side:
::: {layout-ncol=2}
### List One

- Item A
- Item B
- Item C

### List Two

- Item X
- Item Y
- Item Z
:::
Note that headings are automatically combined with the block that follows them, so this markdown has a total of 2 columns to lay out. Here’s an example of a paragraph next to a bullet list (without headings):
::: {layout-ncol=2}
- Item X
- Item Y
- Item Z

Lorem ipsum dolor sit amet, consectetur adipiscing elit. Curabitur gravida eu erat et fring. Morbi congue augue vel eros ullamcorper, eget convallis tortor sagittis. Fusce sodales viverra mauris a fringilla. Donec feugiat, justo eu blandit placerat, enim dui volutpat turpis, eu dictum lectus urna eu urna. Mauris sed massa ornare, interdum ipsum a, semper massa.
:::
For more complicated content use divs (:::) to divide your content into blocks for the layout. For example, here’s how you could lay out a code cell along with some text, next to a figure:
:::: {layout="[ 40, 60 ]"}
::: {#first-column}
```r
# Some code
```
Some text that should be laid out below the code
:::
::: {#second-column}

:::
::::The id attributes (#first-column and #second-column) are optional, but aid readability.