Dashboards with Shiny for Python
Introduction
The Shiny package provides an easy way to build web applications with Python. Quarto dashboards can include embedded Shiny components (e.g. a plot with sliders that control its inputs).
This section assumes you have no experience with Shiny, and will teach you the basic concepts you need to get up and running with Shiny with Quarto.
If you are using R rather than Python, see the documentation on using Shiny for R.
In order to use Shiny within Quarto documents you will need the latest version of the shiny (>=0.9.0) and shinywidgets (>=0.3.1) packages. You can install the latest version of these with:
pip install --upgrade shiny shinywidgetsHello, Shiny
We’ll start with a very simple dashboard that consists of a single plot and some inputs to drive its display:
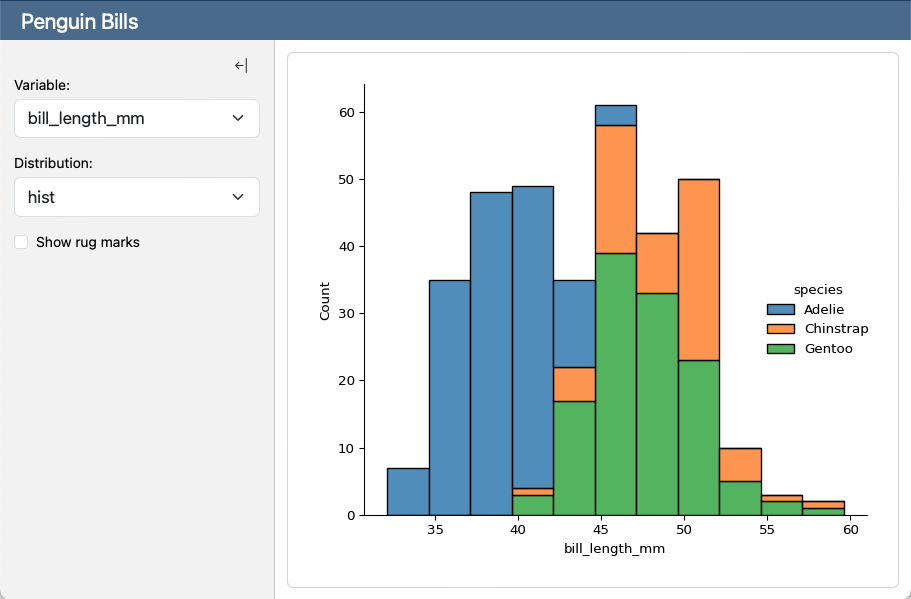
Here is the source code for this dashboard (click on the numbers on the far right for additional explanation):
---
title: "Penguin Bills"
format: dashboard
server: shiny
---
```{python}
import seaborn as sns
penguins = sns.load_dataset("penguins")
```
## {.sidebar}
```{python}
from shiny.express import render, ui
ui.input_select("x", "Variable:",
choices=["bill_length_mm", "bill_depth_mm"])
ui.input_select("dist", "Distribution:", choices=["hist", "kde"])
ui.input_checkbox("rug", "Show rug marks", value = False)
```
## Column
```{python}
@render.plot
def displot():
sns.displot(
data=penguins, hue="species", multiple="stack",
x=input.x(), rug=input.rug(), kind=input.dist())
```- 1
-
The
server: shinyoption instructs Quarto to run a Shiny Server behind the document. - 2
-
Create sidebars by adding the
.sidebarclass to a level 2 heading. Sidebars can include code cells as well as images, narrative, and links. - 3
-
A series of Shiny input elements (interacting with them updates the
inputobject) - 4
-
The plot is rendered and updated according to the current
inputvalues.
In this dashboard, you can choose different values from the select boxes on the left, and the plot will update to reflect your choices. You can also click the checkbox to show or hide rug marks. Let’s go through the construction of this Shiny-enabled dashboard one step at a time.
Metadata
The first thing to do is add server: shiny to the front matter. This tells Quarto that the document should be rendered as a Shiny dashboard (which requires a Python runtime whenever the dashboard is being viewed), rather than as a static HTML page. When you run quarto preview <filename>.qmd on a server: shiny document, Quarto will start and maintain a Shiny process for you and open the dashboard in your browser.
Adding Input Controls
Next, we use functions matching the pattern ui.input_xxx to create input controls. For example, ui.input_select() creates a select box, ui.input_slider() creates a slider, and so on. The values returned by these functions are then rendered into HTML and JavaScript by Quarto.
This example only uses two types of inputs, but Shiny has many more. Use the Shiny Component Browser to see them all, along with code snippets you can copy and paste into your dashboard.
The example above defined an input with the following code:
```{python}
ui.input_select("x", label="Variable:",
                choices=["bill_length_mm", "bill_depth_mm"])
```
Every input function takes an input ID as its first argument. An input ID is string that uniquely identifies this input; it must be a simple, syntactically valid Python variable name. We will use this ID to access the input’s value from other parts of the dashboard.
Make sure each input ID in your Shiny dashboard is unique. If you use the same ID for two different inputs, Shiny will not be able to tell them apart, and your dashboard will not work correctly.
The second argument for each input function is usually a human-readable string that will be displayed next to the input control. For example, the ui.input_select() function passes "Variable:"as the second argument, which is why the select box has the label “Variable:” next to it.
Displaying Dynamic Output
In Shiny, dashboards can contain outputs—plots, tables, text, etc.—that dynamically update in response to user input.
The example above defined a dynamic plot with the following code:
```{python}
@render.plot
def displot():
    sns.displot(
        data=penguins, hue="species", multiple="stack",
        x=input.x(), rug=input.rug(), kind=input.dist())
```
The function here is given the name displot. The body of the function is using typical Seaborn code to create the plot. And a @render.plot decorator is added to the function, to indicate to Shiny that this function should be used to create a plot. (If you haven’t seen decorators before, they’re a Python feature that allows you to add additional behavior to a function.)
The input.x(), input.rug(). and input.dist() method calls are retrieving the values of the x, rug, and dist inputs created earlier in the dashboard.
Note that our code never calls the displot() function! Just the act of defining the function, and decorating it with @render.plot, is enough to tell Shiny and Quarto to:
- Insert a plot into the dashboard at this location.
- Use the function body to create the plot.
- Automatically re-run the function body whenever the values of
input.x(),input.rug(), orinput.dist()change due to user interaction, and use the result to update the existing plot.
This example only contains a single @render.plot output, but it’s possible for Shiny apps to contain multiple outputs, and outputs of different types, as you’ll see in the following example. Check out the Shiny Component Browser to see what types of outputs are available.
Reactive Programming
In the previous section, we said that the displot function would re-run automatically whenever any of the inputs it referred to changed. Shiny is a reactive programming framework, meaning it takes care of tracking the relationships between inputs and outputs in your app. When an input changes, only outputs that are affected by that input are re-rendered. This is a powerful feature that makes it easy to create dashboards that respond to user input efficiently.
The input object is designed to be tracked by Shiny’s reactive framework,
Shiny specifically tracks changes to reactivity-aware objects like the input object, not to just any arbitrary Python variable. You can’t just write x = 100, then use x from the displot function, and expect displot to automatically rerun whenever x changes.
Similarly, Shiny will only automatically re-run functions that are reactivity-aware, like ones decorated with @render.plot. It will not help re-execute code at the top level of the document or code in regular Python functions.
Additional Features
Next, we’ll explore a more in-depth example that covers more features, including factoring out setup code, reactive calculations, and more advanced layout constructs like pages. Here is the interactive document we’ll be building:
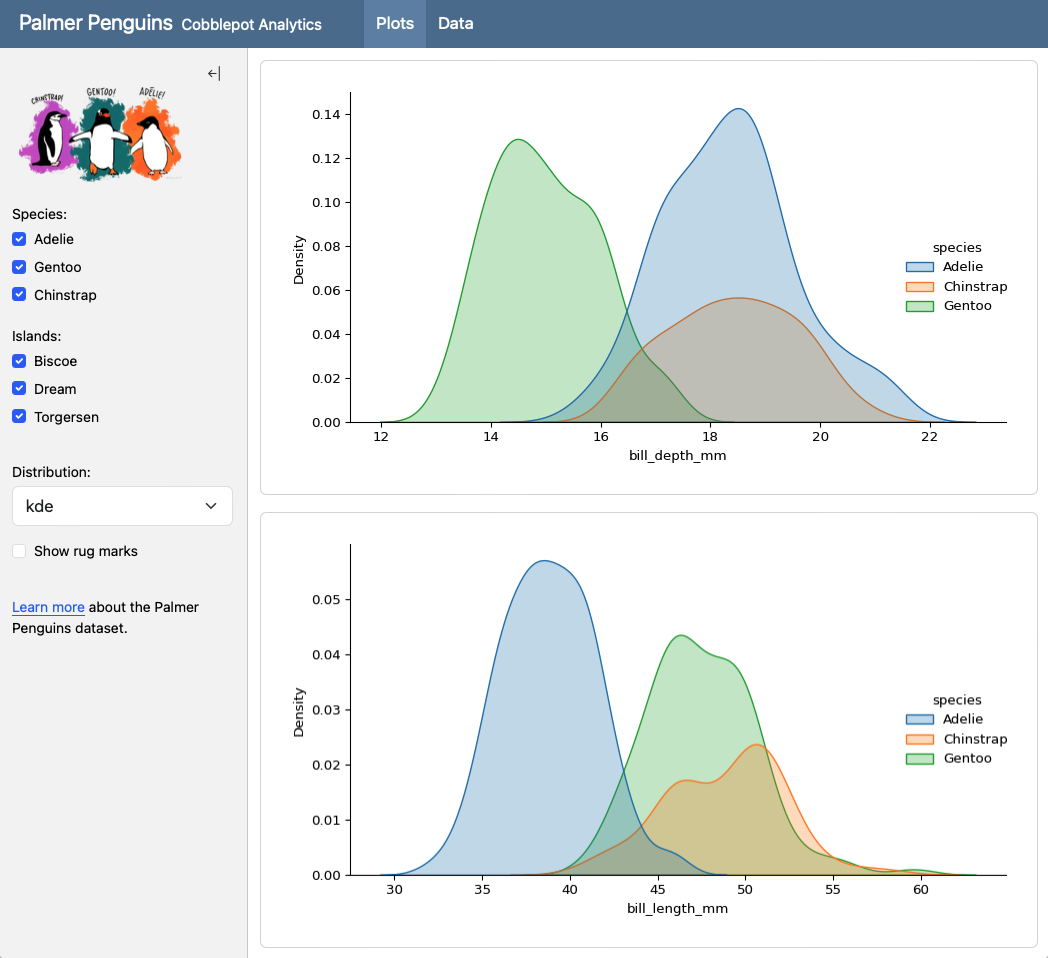
Here is the source code for this dashboard. You can click on the numbers on the far right for additional explanation of syntax and mechanics, and we’ll also explain in more detail below.
---
title: "Palmer Penguins"
author: "Cobblepot Analytics"
format: dashboard
server: shiny
---
```{python}
#| context: setup
import seaborn as sns
from shiny import reactive
from shiny.express import render, ui
penguins = sns.load_dataset("penguins")
```
# {.sidebar}
{width="80%"}
```{python}
species = list(penguins["species"].value_counts().index)
ui.input_checkbox_group(
"species", "Species:",
species, selected = species
)
islands = list(penguins["island"].value_counts().index)
ui.input_checkbox_group(
"islands", "Islands:",
islands, selected = islands
)
@reactive.calc
def filtered_penguins():
data = penguins[penguins["species"].isin(input.species())]
data = data[data["island"].isin(input.islands())]
return data
```
```{python}
ui.input_select("dist", "Distribution:", choices=["kde", "hist"])
ui.input_checkbox("rug", "Show rug marks", value = False)
```
[Learn more](https://pypi.org/project/palmerpenguins/) about the
Palmer Penguins dataset.
# Plots
```{python}
@render.plot
def depth():
return sns.displot(
filtered_penguins(), x = "bill_depth_mm",
hue = "species", kind = input.dist(),
fill = True, rug=input.rug()
)
```
```{python}
@render.plot
def length():
return sns.displot(
filtered_penguins(), x = "bill_length_mm",
hue = "species", kind = input.dist(),
fill = True, rug=input.rug()
)
```
# Data
```{python}
@render.data_frame
def dataview():
return render.DataGrid(filtered_penguins())
```- 1
-
The
server: shinyoption instructs Quarto to run a Shiny Server behind the document. - 2
-
The
context: setupcell option indicates that this code cell should run when the application starts (as opposed to when each new client session starts). Expensive initialization code (e.g. loading data) should be placed incontext: setup. - 3
-
Create global sidebars by adding the
.sidebarclass to a level 1 heading. Sidebars can include code cells as well as images, narrative, and links. - 4
-
These checkbox input groups have their contents dynamically driven from the available categories in the
speciesandislandsfields of the dataset. - 5
-
When the user interacts with the checkbox groups this results in a different filtered view of the dataset. The
@reactive.calcfunction recomputes the filtered dataset and makes it available asfiltered_penguins(). - 6
- These inputs affect the display of plots but not the contents of the filtered dataset.
- 7
-
Level 1 headings (here
# Plotsand# Data) create pages within the dashboard. - 8
-
Plots are rendered by referencing the filtered dataset (
filtered_penguins()as well as the plot display oriented inputs (input.dist()andinput.rug()). Plots are automatically re-rendered when the dataset or these inputs change. - 9
-
The Data tab also references
filtered_penguins()and is updated whenever the filtered data changes.
Setup Cell
In static Quarto documents, {python} code cells run only when the document is rendered, not when it is viewed. In server: shiny documents, {python} code cells are run both during render time and each time the dashboard is loaded in a browser. This is important because each visitor to the dashboard needs their own independent copies of inputs/outputs in memory, so that simultaneous users don’t interfere with each other.
However, sometimes we have code that would be excessive to run for every user, and we only want the code to run once, when the document’s Shiny runtime process is starting up. For example, in the example above, we import packages and load data using sns.load_dataset("penguins"):
```{python}
#| context: setup
import seaborn as sns
from shiny import reactive
from shiny.express import render, ui
penguins = sns.load_dataset("penguins")
```We do this in a setup cell because it would be wasteful in terms of both time and memory to load the data once for each user, instead of once for the process.
By simply adding #| context: setup to the code cell, we can tell Quarto to run the code only once, when the Shiny process starts up. Setup cells are a great way to factor out code that you want to run once, not on every page load. Variables you define in setup cells can be read by all other code cells in the document.
Dashboard Pages
At the top of this dashboard, you can see “Plots” and “Data” headings. These are called dashboard pages. Dashboard pages are a way to organize your dashboard into multiple pages, each with its own set of outputs. You can insert dashboard pages by adding level 1 headings to your Markdown. In this case, # Plots and # Data:
# Plots

# Data
Data Frame Outputs
On the Data page, there’s a dynamic data frame output. This is created by the following code:
```{python}
@render.data_frame
def dataview():
    return render.DataGrid(filtered_penguins())
```
In a @render.data_frame function, you can simply return a Pandas data frame, and Shiny will automatically render it as an interactive data grid. (The filtered_penguins() function is a reactive calculation that returns a data frame–we’ll explore that next.)
You also have the option of wrapping the data frame object in a render.DataGrid or render.DataTable constructor; in this case, we’re using the former. This is not strictly necessary, but it allows you to set additional options on the data grid or table, such as filtering and selection.
The only difference between render.DataGrid and render.DataTable is the appearance of the rendered table: render.DataGrid uses a more compact, spreadsheet-like appearance, while render.DataTable uses a more traditional table appearance.
Reactive Calculations
In this example, the user uses select boxes to filter a dataset, and the filtered dataset is displayed in three different dynamic outputs: two plots and a data frame. Remember that as inputs change, Shiny automatically re-executes functions decorated with @render.plot and @render.data_frame that are affected by those inputs. But where do we put the code that filters the dataset?
The most obvious place would be to duplicate the code in each of the three rendering functions. But this is a bad idea, both because duplicate code is annoying to maintain, and because it would be inefficient to re-run the same filtering code three times just to get the exact same results. We could extract the duplicated code into a function, which would remove the maintenance problem, but it would not be any more efficient.
Shiny has a solution: reactive calculations. A reactive calculation is a reactive-aware function that is re-executed whenever its inputs change, but whose return value is not rendered into the dashboard. Instead, the return value is cached, and can be accessed by rendering functions (or even by other reactive calculations). This allows us to place the filtering logic in a single reactive calculation, and then have the three rendering functions access the filtered dataset from the reactive calculation.
To create a reactive calculation, we use the @reactive.calc decorator. The following code creates a reactive calculation called filtered_penguins:
```{python}
@reactive.calc
def filtered_penguins():
    data = penguins[penguins["species"].isin(input.species())]
    data = data[data["island"].isin(input.islands())]
    return data
```
To read the value of a reactive calc, call it like a function. For example, the depth plot looks like this:
```{python}
@render.plot
def depth():
    return sns.displot(
        filtered_penguins(), x = "bill_depth_mm",
        hue = "species", kind = input.dist(),
        fill = True, rug=input.rug()
    )
```
Note the filtered_penguins() call. To reiterate, this call does not necessarily cause the filtered_penguins function to run. Instead, it usually returns the cached value of the function, which is automatically updated whenever the inputs it refers to change. And because the depth plot refers to the filtered_penguins calculation, it will be re-rendered whenever those inputs change.
Learning More
To learn more about Shiny for Python interactive documents see the following articles:
Component Browser enumerates the available Shiny inputs and outputs, along with code snippets you can copy and paste into your dashboard.
Input Layout describes various ways to layout Shiny inputs (sidebars, input panels, attaching inputs directly to cards, etc.)
Running Dashboards covers in more depth how to run Shiny dashboards both within VS Code, Positron, and at the command line, as well as how to deploy them to end users.
Execution Contexts goes in depth on when different code cells run (e.g. rendering vs. serving).
Shiny for Python provides in-depth documentation on all of the available UI and ouput widgets, as well as conceptual discussions on how things work.