```{mermaid}
flowchart LR
  A[Hard edge] --> B(Round edge)
  B --> C{Decision}
  C --> D[Result one]
  C --> E[Result two]
```
flowchart LR
A[Hard edge] --> B(Round edge)
B --> C{Decision}
C --> D[Result one]
C --> E[Result two]
Quarto has native support for embedding Mermaid and Graphviz diagrams. This enables you to create flowcharts, sequence diagrams, state diagrams, gantt charts, and more using a plain text syntax inspired by markdown.
For example, here we embed a flowchart created using Mermaid:
```{mermaid}
flowchart LR
  A[Hard edge] --> B(Round edge)
  B --> C{Decision}
  C --> D[Result one]
  C --> E[Result two]
```flowchart LR
A[Hard edge] --> B(Round edge)
B --> C{Decision}
C --> D[Result one]
C --> E[Result two]
As illustrated above, Mermaid diagrams are embedded using {mermaid} executable cells. Graphviz diagrams are embedded using {dot} executable cells. Note that cell options are added with slightly different syntax: %%| for {mermaid}, and //| for {dot}.
For print output formats like pdf or docx, diagram rendering makes use of the Chrome or Edge web browser to create a high-quality PNG. Quarto can automatically use an existing version of Chrome or Edge on your system, or alternatively if you don’t have either installed, you can install a lighter-weight version called Chrome Headless Shell (see Chrome Install below for details).
Mermaid is a Javascript based diagramming and charting tool that uses Markdown-inspired text definitions and a renderer to create and modify complex diagrams.
Mermaid diagrams use %% as their comment syntax, and so cell options are declared using %%|. Cell options must be included directly beneath the start of the diagram code chunk.
Above we demonstrated a flowchart created with Mermaid, here is a sequence diagram (also embedded using a {mermaid} executable cell):
```{mermaid}
sequenceDiagram
  participant Alice
  participant Bob
  Alice->>John: Hello John, how are you?
  loop Healthcheck
    John->>John: Fight against hypochondria
  end
  Note right of John: Rational thoughts <br/>prevail!
  John-->>Alice: Great!
  John->>Bob: How about you?
  Bob-->>John: Jolly good!
```
sequenceDiagram
participant Alice
participant Bob
Alice->>John: Hello John, how are you?
loop Healthcheck
John->>John: Fight against hypochondria
end
Note right of John: Rational thoughts <br/>prevail!
John-->>Alice: Great!
John->>Bob: How about you?
Bob-->>John: Jolly good!
Note that Mermaid output varies depending on the target format (e.g. HTML vs. print-based). See the section below on Mermaid Formats for additional details.
To learn more about using Mermaid, see the Mermaid website or the Mermaid book (which is written by the creator of Mermaid).
The Graphviz layout programs take descriptions of graphs in a simple text language, and make diagrams in useful formats. Graphviz has many useful features for concrete diagrams, such as options for colors, fonts, tabular node layouts, line styles, hyperlinks, and custom shapes.
Graphviz diagrams use // as their comment syntax, and so cell options are declared using //|. Cell options must be included directly beneath the start of the diagram code chunk.
For example, here is a simple undirected graph created using graphviz:
```{dot}
graph G {
  layout=neato
  run -- intr;
  intr -- runbl;
  runbl -- run;
  run -- kernel;
  kernel -- zombie;
  kernel -- sleep;
  kernel -- runmem;
  sleep -- swap;
  swap -- runswap;
  runswap -- new;
  runswap -- runmem;
  new -- runmem;
  sleep -- runmem;
}
```To learn more about Graphviz, see the Graphviz website, this list of simple Graphiz Examples, or the Graphviz Gallery.
There are a variety of tools available to improve your productivity authoring diagrams:
The Mermaid Live Editor is an online tool for editing and previewing Mermaid diagrams in real time.
Graphviz Online provides a similar tool for editing Graphviz diagrams.
RStudio includes support for editing and previewing .mmd and .dot files (with help from the DiagrammeR package).
The Quarto Extension for VS Code and Positron (available on both OpenVSX and Microsoft’s marketplace) supports live preview of diagrams embedded in .qmd files and in .mmd and .dot files:
Diagrams can be treated as figures the same way that images and plot output are. For example, if we added the following figure options to the diagram above:
```{dot}
//| label: fig-simple
//| fig-cap: "This is a simple graphviz graph."
```
We’d get this output:
We could then create a cross-reference to the diagram with:
@fig-simpleTo create a cross-references to a diagram using div syntax, treat it like a figure. For example, Figure 2 is created using:
::: {#fig-simple}

```{dot}
graph {
  A -- B
}
```

This is a simple graphviz graph
:::If you would rather give diagrams a label and counter distinct from figures, consider defining Custom Cross-Reference Types.
You might find it more convenient to edit your diagram in a standalone .dot or .mmd file and then reference it from within your .qmd document. You can do this by adding the file option to a Mermaid or Graphviz cell.
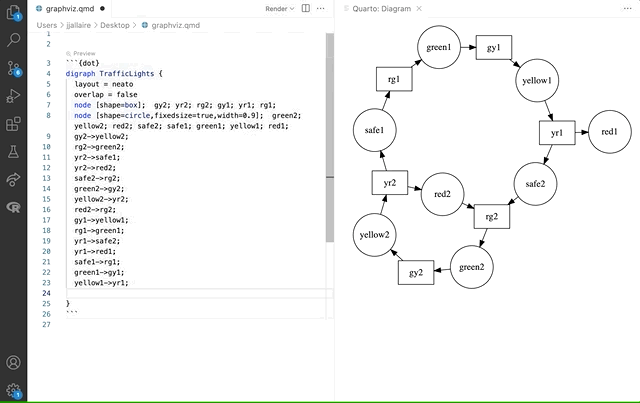
For example, here we include a very complex diagram whose definition would be too unwieldy to provide inline:
```{dot}
//| label: fig-linux-kernel
//| fig-cap: "A diagram of the Linux kernel."
//| file: linux-kernel-diagram.dot
```Note that the label and fig-cap attributes still work as expected with file includes.
By default, diagrams are rendered at their natural size (i.e. they are not stretched to fit the default figure size for the current document). Within HTML output formats, diagrams are also made responsive, so that their width doesn’t overflow the current page column. This is similar to the treatment given to images and dynamic JavaScript widgets.
You can disable responsive sizing by specifying the fig-responsive: false option. You can also specify explicit sizes via fig-width and fig-height. For example, here we want to make a mermaid diagram a bit bigger because it contains only a few elements:
```{mermaid}
%%| fig-width: 6.5
flowchart LR
  A[Hard edge] --> B(Round edge)
  B --> C{Decision}
```
flowchart LR
A[Hard edge] --> B(Round edge)
B --> C{Decision}
When you include a Mermaid diagram in a document, the diagram format used is chosen automatically based on the output format:
| Format | Output |
|---|---|
HTML (html, revealjs, etc.) |
Mermaid native (JavaScript) |
GitHub Flavored Markdown (gfm) |
Mermaid code block |
Other Formats (pdf, docx, etc.) |
PNG image |
The Mermaid native format is used by default whenever the underlying output format supports JavaScript.
When using format: gfm, diagrams will be emitted as plain mermaid code blocks. This is because both GitHub and GitLab natively support rendering Mermaid diagrams from code.
For formats that don’t do special handling of Mermaid or lack a JavaScript run-time (e.g. formats like pdf, docx, epub, etc.) a PNG image is created using Chrome.
You can change the default behavior using the mermaid-format option. For example:
---
format:
  gfm:
    mermaid-format: png
---
Valid values for mermaid-format include js, png, and svg,
When rendering to LaTeX-based formats, mermaid-format: svg requires additional tooling and may have rendering issues:
rsvg-convert or inkscape must be available in your system PATH for Quarto to convert SVG to PDF to include in LaTeX.mermaid-format: png for PDF output with LaTeX.For more details, including installation instructions and Inkscape configuration, see SVG Images.
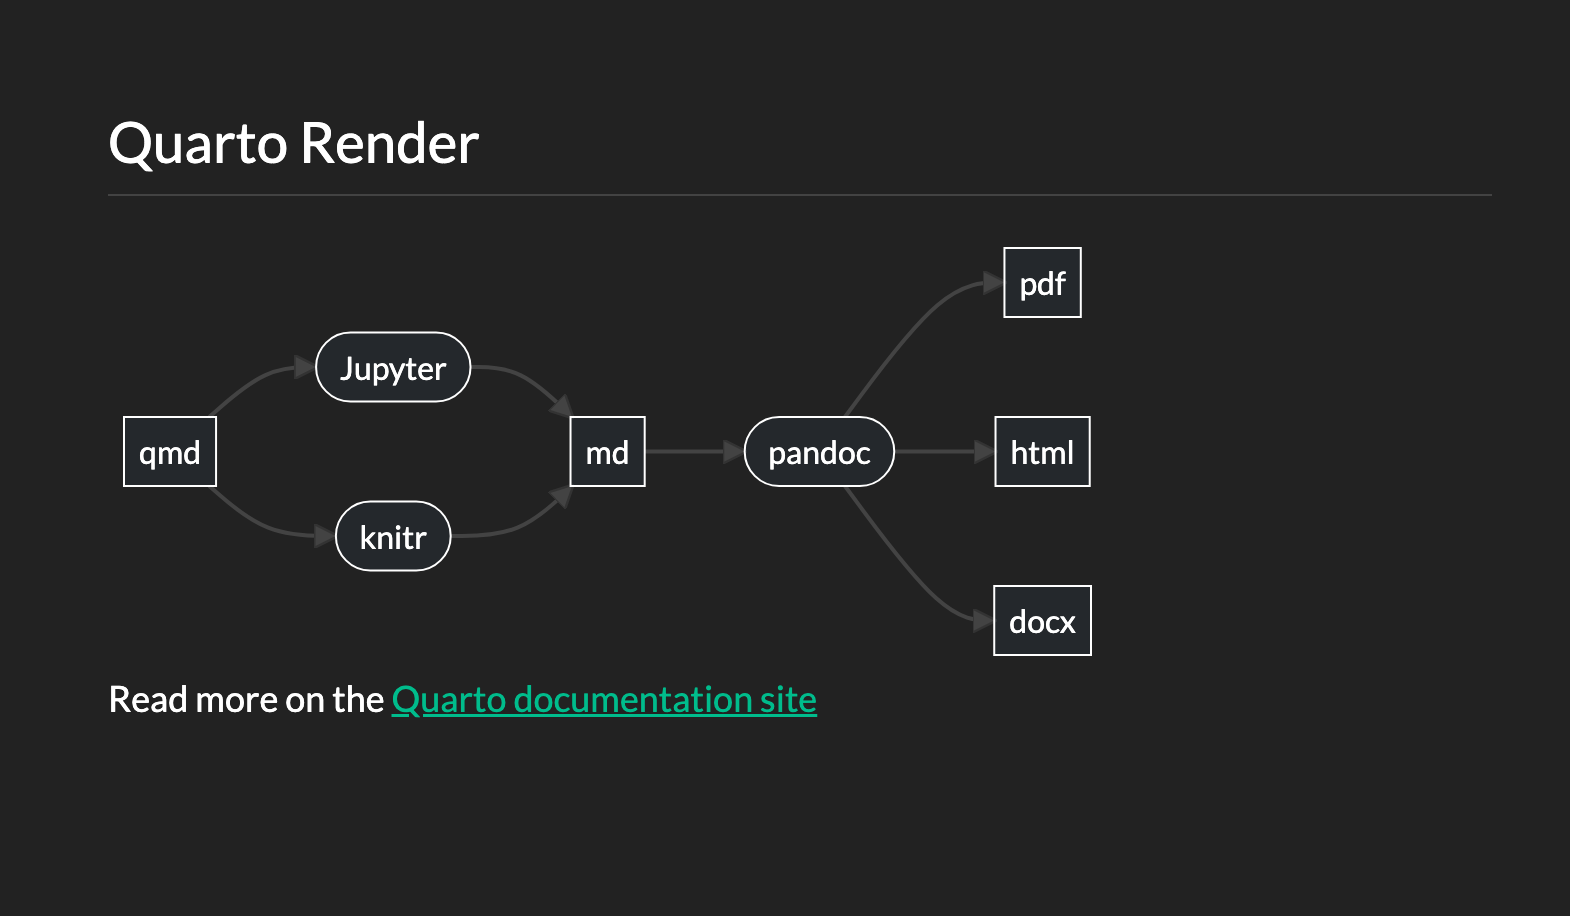
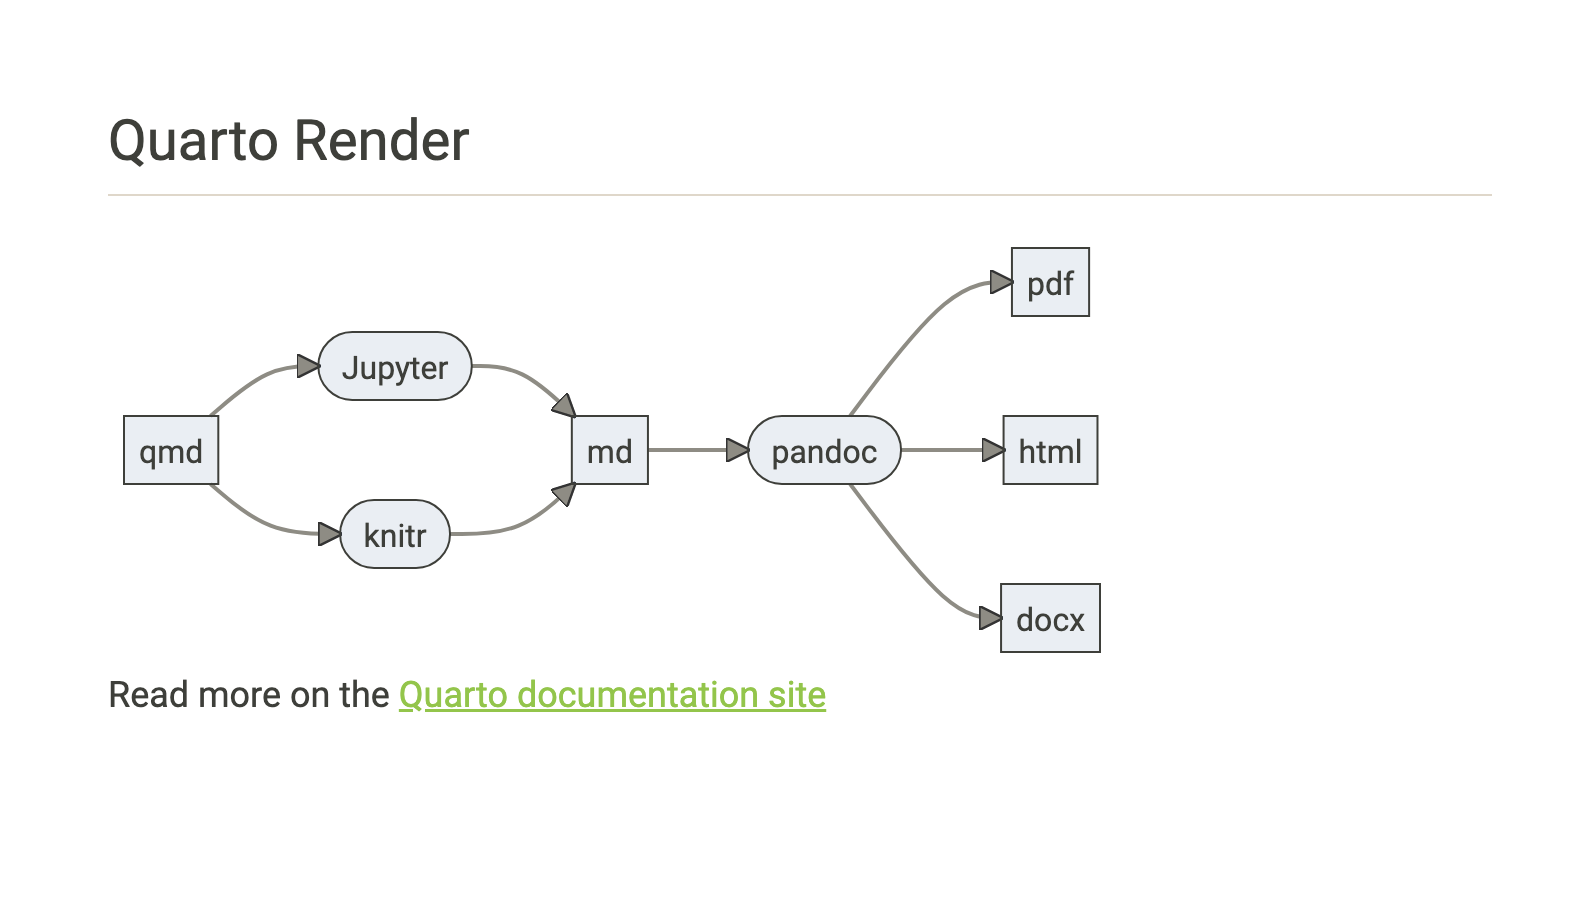
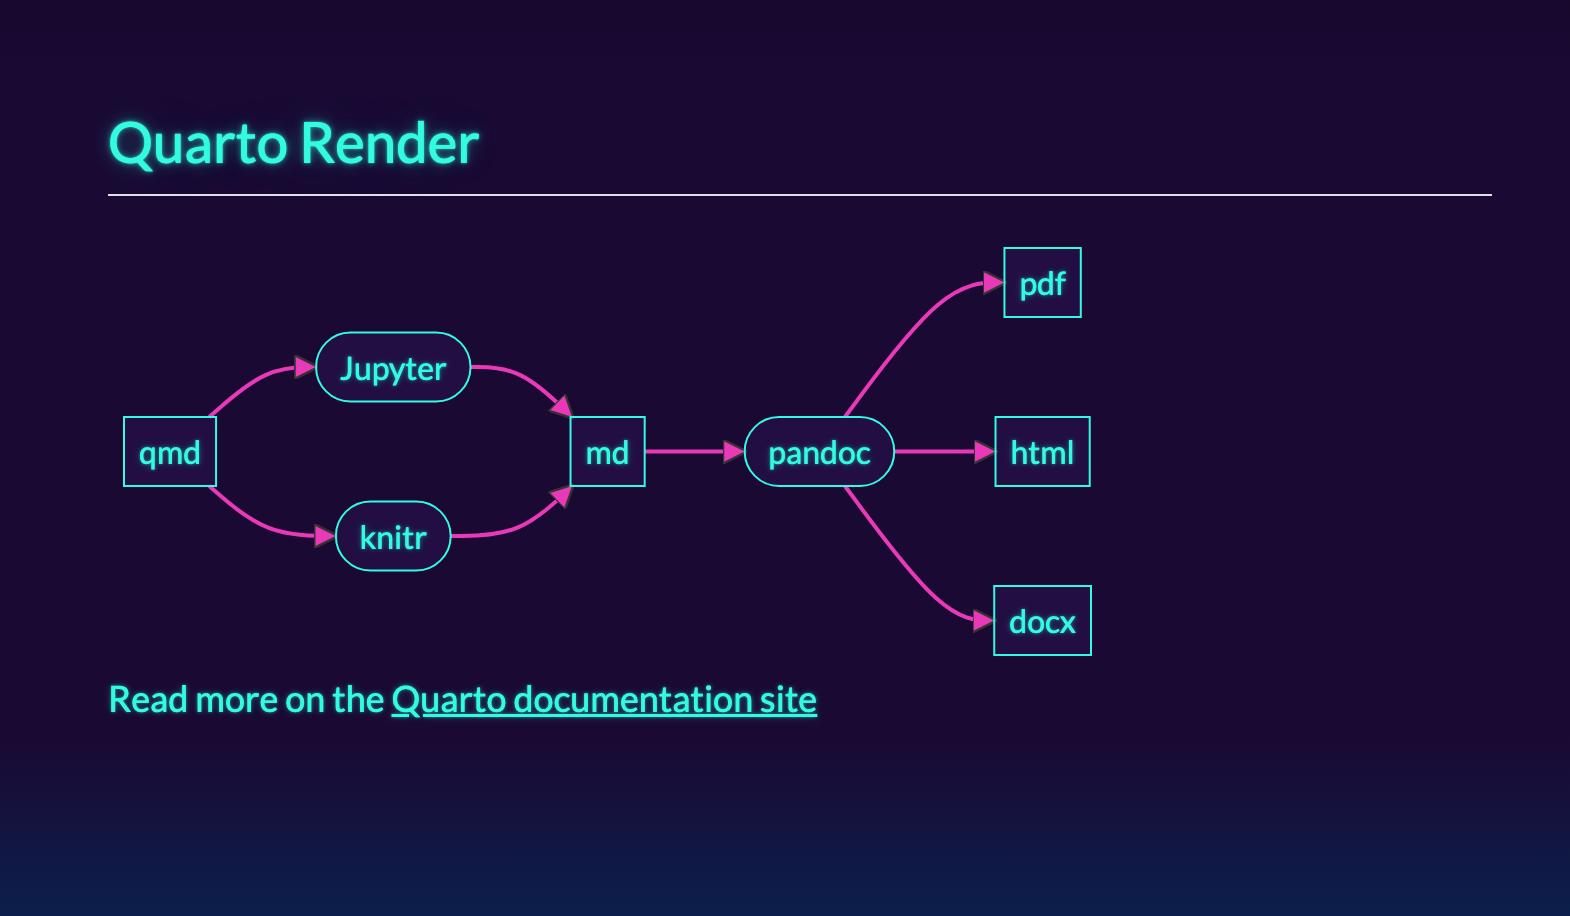
The following sections describe the ways in which you can control the color theme of Mermaid diagrams:
If you use Quarto’s bootswatch built-in themes, including the default theme, or a custom theme that uses the same SCSS variables, your Mermaid diagrams will automatically follow your theme.
The following examples demonstrate this with a few of Quarto’s built-in bootswatch themes.
You can read more about the correspondence between Bootstrap’s SCSS variables and Quarto’s Mermaid SCSS variables, and how to change it, below in Customizing the Mermaid Theme.
If you want to use Mermaid’s own themes, you can do so by configuring the mermaid option in your YAML front matter:
format:
  html:
    mermaid:
      theme: forest
The available themes from mermaid are: default, dark, forest, and neutral.
Quarto provides its own Mermaid SCSS and CSS variables that can be overwritten to allow some customization of the diagram theme. The SCSS variables, together with their default values, are:
$mermaid-bg-color: $body-bg;
$mermaid-edge-color: $secondary;
$mermaid-node-fg-color: $body-color;
$mermaid-fg-color: $body-color;
$mermaid-fg-color--lighter: lighten($body-color, 10%);
$mermaid-fg-color--lightest: lighten($body-color, 20%);
$mermaid-font-family: $font-family-sans-serif;
$mermaid-label-bg-color: $body-bg;
$mermaid-label-fg-color: $primary;
$mermaid-node-bg-color: rgba($primary, 0.1);
$mermaid-node-fg-color: $primary;
Their CSS variable counterparts are:
:root {
  --mermaid-bg-color: #{$mermaid-bg-color};
  --mermaid-edge-color: #{$mermaid-edge-color};
  --mermaid-node-fg-color: #{$mermaid-node-fg-color};
  --mermaid-fg-color: #{$mermaid-fg-color};
  --mermaid-fg-color--lighter: #{$mermaid-fg-color--lighter};
  --mermaid-fg-color--lightest: #{$mermaid-fg-color--lightest};
  --mermaid-font-family: #{$mermaid-font-family};
  --mermaid-label-bg-color: #{$mermaid-label-bg-color};
  --mermaid-label-fg-color: #{$mermaid-label-fg-color};
  --mermaid-node-bg-color: #{$mermaid-node-bg-color};
  --mermaid-node-fg-color: #{$mermaid-node-fg-color};
}
For example, to provide a custom color for the background of the nodes you could add a custom CSS stylesheet containing:
:root {
  --mermaid-node-bg-color: #375a7f;
}
You can find the correspondence between Quarto’s variables and Mermaid’s native CSS classes in Quarto’s source code in the file embed-mermaid.css.
Note that unlike other executable cell handlers (e.g. {python}), cells with diagrams don’t display their code in the rendered document by default. You can display code by adding an echo: true option in a comment at the top the cell.
To include code for {mermaid}, add %%| echo: true to the top of the cell. For example:
```{mermaid}
%%| echo: true
```
To include code for {dot}, add //| echo: true to the top of the cell. For example:
```{dot}
//| echo: true
```For printing to output formats like pdf or docx, diagram rendering makes use of the Chrome or Edge web browser to create a high-quality PNG.
Quarto can automatically use an existing version of Chrome or Edge on your system for rendering. Alternatively, if you don’t have either installed, you can install Chrome Headless Shell for use by Quarto:
Terminal
quarto install chrome-headless-shellChrome Headless Shell is a lightweight, headless-only browser from Google’s Chrome for Testing infrastructure. It has fewer system dependencies than full Chromium, making it a good fit for Docker containers and WSL environments.
The quarto install chromium command is deprecated as of Quarto 1.9 and will be removed in a future release. It still works but displays a deprecation warning. To migrate to Chrome Headless Shell, run:
Terminal
quarto uninstall chromium
quarto install chrome-headless-shell
The Puppeteer-bundled Chromium installed by the old command may not work in Docker or WSL — see Puppeteer troubleshooting for details. Chrome Headless Shell does not have these limitations and also supports arm64 Linux.