Dashboards with Observable JS
Introduction
Quarto includes native support for Observable JS, a set of enhancements to vanilla JavaScript created by Mike Bostock (also the author of D3). Observable JS is distinguished by its reactive runtime, which is especially well suited for interactive data exploration and analysis.
The creators of Observable JS (Observable, Inc.) run a hosted service at https://observablehq.com/ where you can create and publish notebooks. Additionally, you can use Observable JS (“OJS”) in standalone documents and websites via its core libraries. Quarto uses these libraries along with a compiler that is run at render time to enable the use of OJS within Quarto documents.
Walkthrough
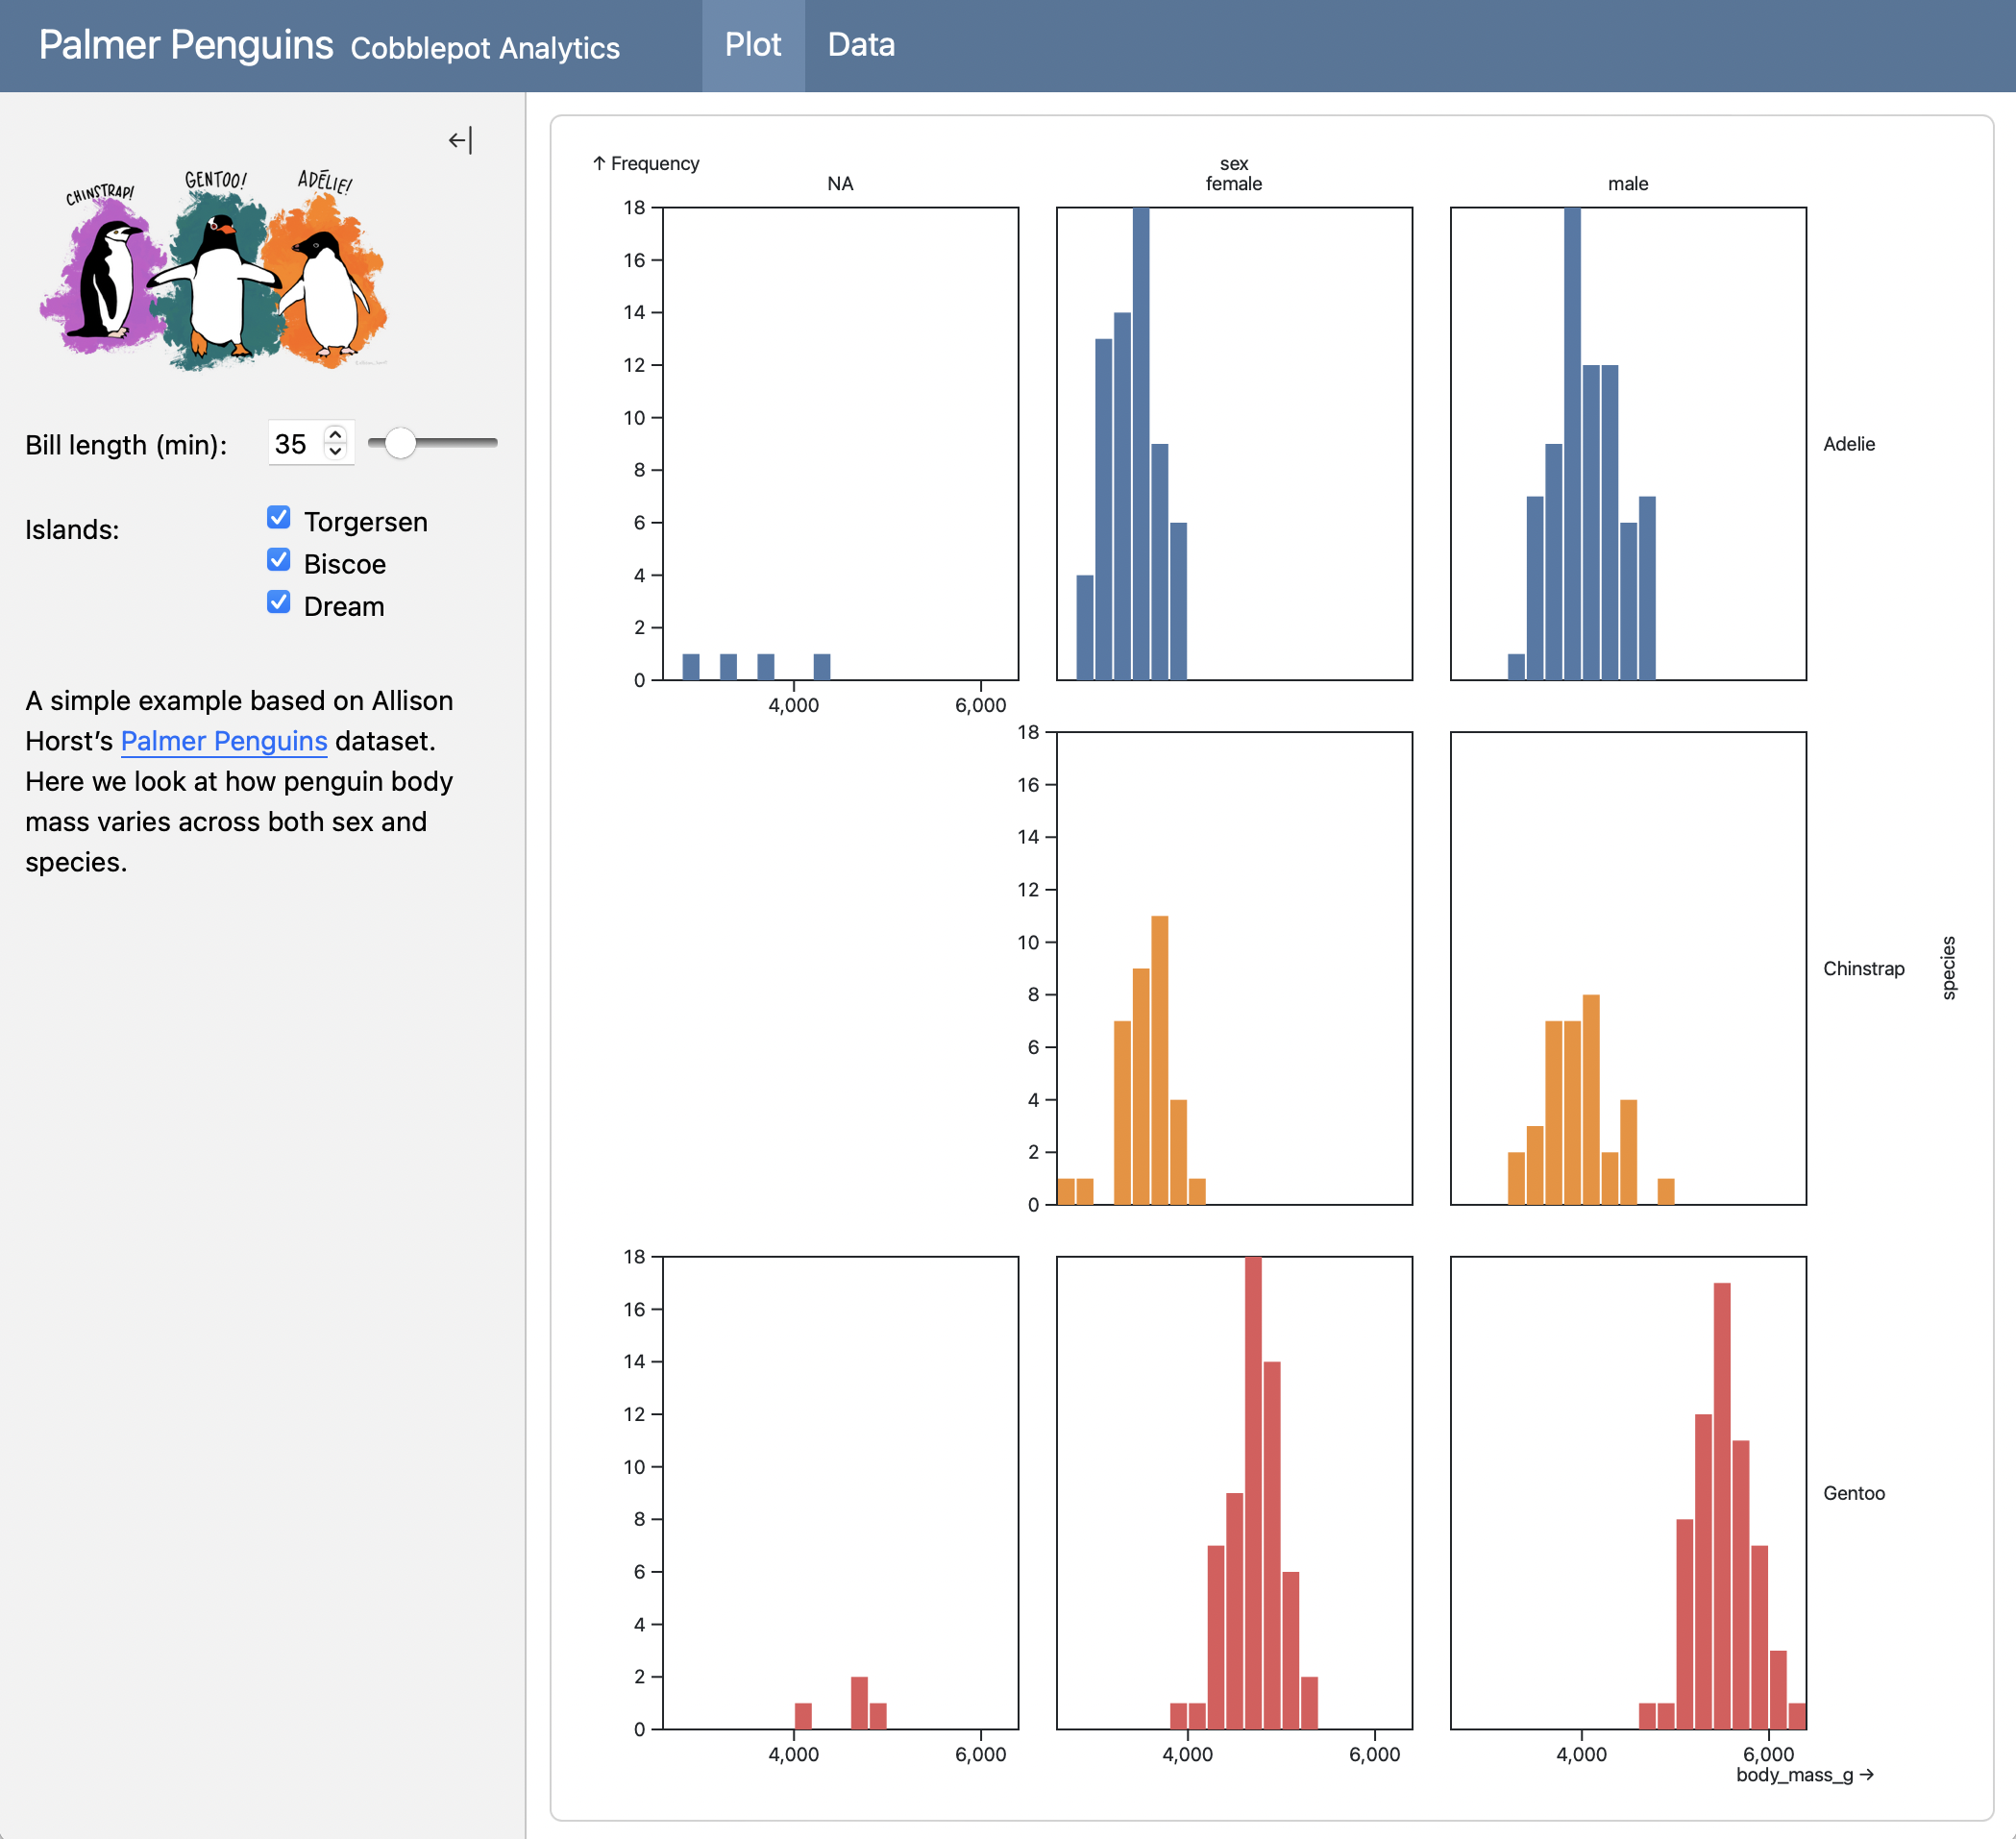
Quarto Dashboards are a great way to present interactive OJS visualizations. Below we’ll provide a complete example which will give you a high level view of the basics. If you want to learn more, please see the complete documentation on Using OJS with Quarto.
This example covers many of the techniques you’ll use when creating dashboards with OJS, including reactive calculations and more advanced layout constructs like sidebars and tabsets. Here is the interactive document we’ll be building:
The source code for this dashboard is below. Note that we add the
//| output: false option to the first cell: this is to designate the cell as having only intermediate computations (so it should not be turned into a card in the dashboard layout).
Click on the numbers on the far right for additional explanation of syntax and mechanics)
---
title: "Palmer Penguins"
author: "Cobblepot Analytics"
format: dashboard
---
```{ojs}
//| output: false
data = FileAttachment("penguins.csv")
.csv({ typed: true })
filtered = data.filter(function(penguin) {
return bill_length_min < penguin.bill_length_mm &&
islands.includes(penguin.island);
})
```
# {.sidebar}
{width="80%"}
```{ojs}
viewof bill_length_min = Inputs.range(
[32, 50],
{value: 35, step: 1, label: "Bill length (min):"}
)
viewof islands = Inputs.checkbox(
["Torgersen", "Biscoe", "Dream"],
{ value: ["Torgersen", "Biscoe", "Dream"],
label: "Islands:"
}
)
```
# Plot
```{ojs}
Plot.rectY(filtered,
Plot.binX(
{y: "count"},
{x: "body_mass_g", fill: "species", thresholds: 20}
))
.plot({
facet: {
data: filtered,
x: "sex",
y: "species",
marginRight: 80
},
marks: [
Plot.frame(),
]
}
)
```
# Data
```{ojs}
Inputs.table(filtered)
```- 1
-
We set
output: falseto indicate that this cell includes only intermediate calculations and should not have its contents printed. - 2
- We read the raw penguins dataset from a CSV when the page loads.
- 3
-
filteredis a value that is automatically recomputed when variables declared withviewofchange (in this casebill_length_minandislands). - 4
-
Create global sidebars by adding the
.sidebarclass to a level 1 heading. Sidebars can include code cells as well as images, narrative, and links. - 5
-
Here we define our inputs using
viewofso that thefiltereddataset is automatically recomputed when they change. - 6
-
Level 1 headings (here
# Plotsand# Data) create pages within the dashboard. - 7
-
The plot is automatically redrawn whenever the
filtereddataset changes. - 8
-
The tabular data display is automatically refreshed whenever the
filtereddataset changes.
Learning More
To learn more about using OJS with Quarto, see the following articles:
Input describes various ways to layout inputs (sidebars, input panels, attaching inputs directly to cards, etc.).
Using OJS provides an introduction and overview of other topics.
OJS Libraries covers using standard libraries and external JavaScript libraries.
OJS Data Sources outlines the various ways to read and pre-process data.
OJS Cells goes into more depth on cell execution, output, and layout.
OJS Code Reuse delves into ways to re-use OJS code across multiple documents.